SOL at $500 Price In View as Solana Hits 26-Month High with Crowd Sentiment Turning Super Bullish


As the crypto market continues to take centre stage thanks to the uptrend, Solana (SOL) is riding on this wave after hitting levels last seen in January 2022.
Solana recently soared to the $197 zone thanks to positive crowd sentiment, as highlighted by Santiment.
The leading on-chain metrics provider disclosed that Solana was enjoying at least 54% positive crowd sentiment from various platforms, such as Twitter, Telegram, and Reddit.
Therefore, this shows that Solana is enjoying heightened investor interest, which is one of the factors making it to scale heights.
Is the $500 Zone Likely For Solana?
As bullish momentum trickles into the Solana network, top crypto analyst Rekt Capital believes that the fifth-largest cryptocurrency based on market value might revisit the $250 area, which is a major resistance. 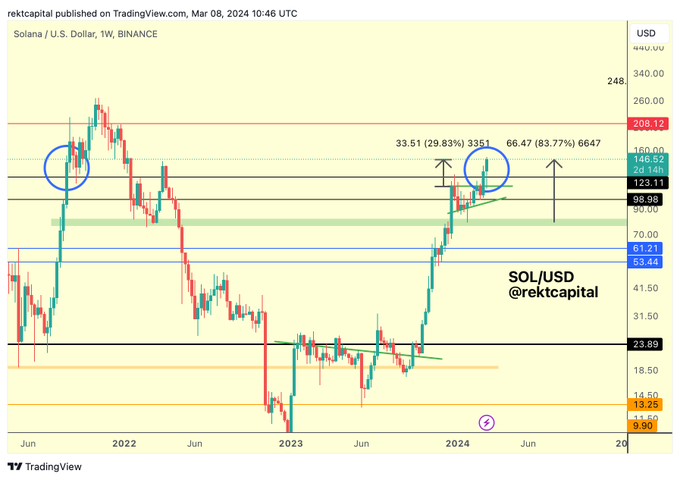
Based on Rekt Capital’s analysis, no major stumbling block exists for Solana hitting the psychological price of $500. If this is attained, SOL will validate its quest to go past the all-time high price of $259 recorded in November 2021.
On the other hand, the Fibonacci level at 61.8% shows that Solana’s intention of soaring to $500 will become a reality once a breakout from the $358 zone is achieved.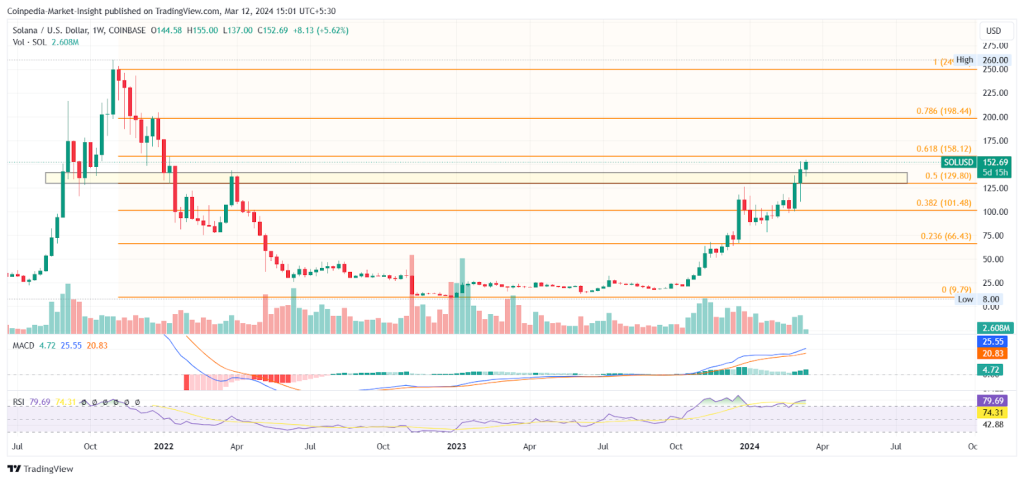
Solana was hovering around the $196 zone at press time, according to CoinGecko data.
Meanwhile, March is turning out to be a good month for Solana as SOL continues to be in the green based on various factors, such as price momentum, supply and demand, and market conditions.
Solana’s growing meme coin ecosystem is also instrumental in the current uptrend, with meme coins such as WIF and BONK leading the pack.
Solana: How high will SOL prices go in April?
April could be a big month for Solana as it sees high activity from the memecoins on the network.

- SOL jumped by more than 50% in the month.
Solana [SOL] ecosystem’s coffers were filled to the brink in March, following increased traffic on its blockchain.
Solana smiles all the way to the bank
The smart contracts network raked in a whopping $31.58 million as of the 30th of March, as per AMBCrypto’s analysis of Token Terminal data, becoming the third-highest revenue generator in the broader Web3 industry.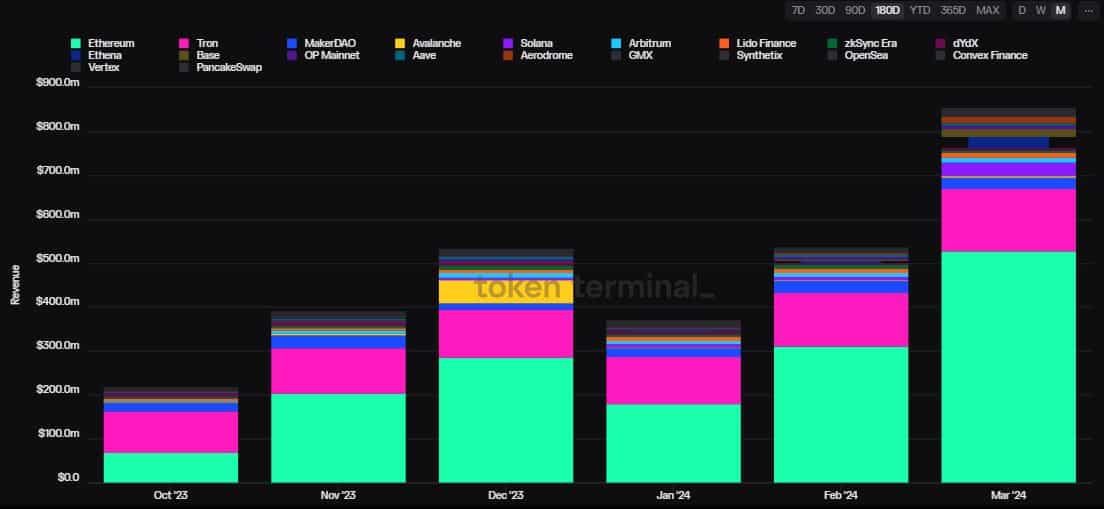 Source: Token Terminal
Solana flipped lending protocol MakerDAO [MKR], which consistently held the third spot in recent months. Ethereum [ETH] and Tron [TRX] remained the top two revenue generators.
As obvious, the revenue uptick followed an explosion in memecoin trading on the platform. A barrage of coins were minted on the chain one after the other, drawing crypto degens who do not require a second invitation in such instances.
The speculation led to higher number of transactions, in turn generating significant fee revenue for the network.
SOL was one of the top performers in March
The ecosystem’s native token SOL reaped benefits from the blockchain’s increased utilization. The fifth-largest coin jumped by more than 50% in the month, becoming one of the biggest market gainers, according to CoinMarketCap.
Note that Solana burns 50% of its fee revenue, meaning that more the fees collected, more will be the deflationary pressure on SOL.
The price surge also got derivatives traders interested. According to AMBCrypto’s analysis of Coinglass’ data, the Open Interest (OI) in SOL futures increased to $2.74 billion at press time. This marked a 43% increase over the month.
A rising OI accompanied by a rising market value is indicative of a bullish market.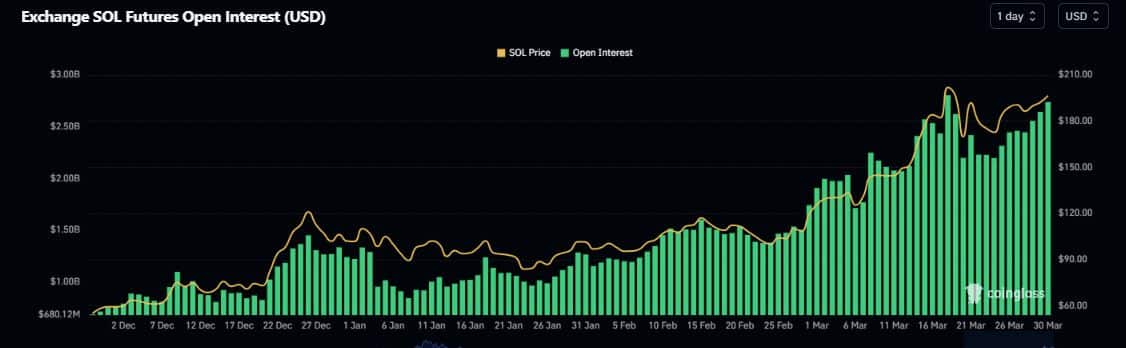 Source: Coinglass
Realistic or not, here’s SOL’s market cap in BTC’s terms
As of this writing, SOL was just 21% shy of its all-time high (ATH) of $249, set in November 2021. Popular crypto commentator Captain Faibik had recently predicted that the new ATH would be hit sometime in April.
If the forecast comes true, it would be some feat for the asset which plunged to $18 during the peak crypto winter of November 2022.
Shiba Inu [SHIB] is a success, what's stopping Shibarium?
2min Read
The past few weeks have been marked by a decline in network activity on Shibarium.

- Shibarium has seen a decline in user activity in the past two weeks.
- SHIB’s Chaikin Money Flow hints at the possibility of a price decline.
Daily transaction fees on Shiba Inu’s [SHIB] Layer 2 (L2) network Shibarium have fallen to their lowest level since the beginning of the year, according to data from Shibariumscan.
AMBCrypto found that the total amount recorded by the L2 network in transaction fees cratered to a low of 4.02 BONE, amounting to $4 on 29th March. This represented a 97% decline from the year-to-date (YTD) high of 211 BONE Shibarium recorded on 4th January. ![]() Source: Shibarium
Source: Shibarium
Why transaction fees plunged on the network
The decline in transaction fees on Shibarium is due to the sudden fall in user activity on the L2 network since 18th March.
According to Shibariumscan, the daily count of active addresses completing transactions on the network rose to its YTD high of 2482 on that day before trending downward.
As of 29th March, only 835 unique addresses were active on Shibarium. This marked a 66% decline in blockchain network activity within two weeks.
Further, new demand for the L2 platform has also dwindled during the period under review. AMBCrypto found that the count of new addresses created daily on Shibarium has since dropped by 85%.
Due to the decline in new demand and user activity on Shibarium, the number of new transactions completed on the L2 network daily has dropped significantly in the last month.
As of 29th March, the number of new transactions executed on the network totaled 172,285. This marked a 96% decline from the 3.92 million new transactions completed on 20th February.
Look out for this
At press time, SHIB was worth $0.0000306. The general market’s rally last week impacted the memecoin, which, according to CoinMarketCap’s data, rose by 12% in the past seven days.
An assessment of its key momentum indicators on a daily chart revealed that the price rally has been backed by a steady demand for the altcoin. For example, its Money Flow Index (MFI) trended upward to return a value of 71.19.
Likewise, the coin’s Relative Strength Index (RSI) rested above its center line at 58. 06. These values showed that market participants have favored SHIB accumulation over its distribution in the last week.
Read Shiba Inu’s [SHIB] Price Prediction 2024-25
However, while buying activity may exist, readings from SHIB’s Chaikin Money Flow (CMF) showed that it may not be strong enough to initiate a significant surge in the coin’s value in the short term.
The coin’s CMF indicator measures the flow of money into and out of the asset. At the time of writing, it was resting on the zero line and poised to form a bearish divergence, which may be followed by a decline in SHIB’s price. 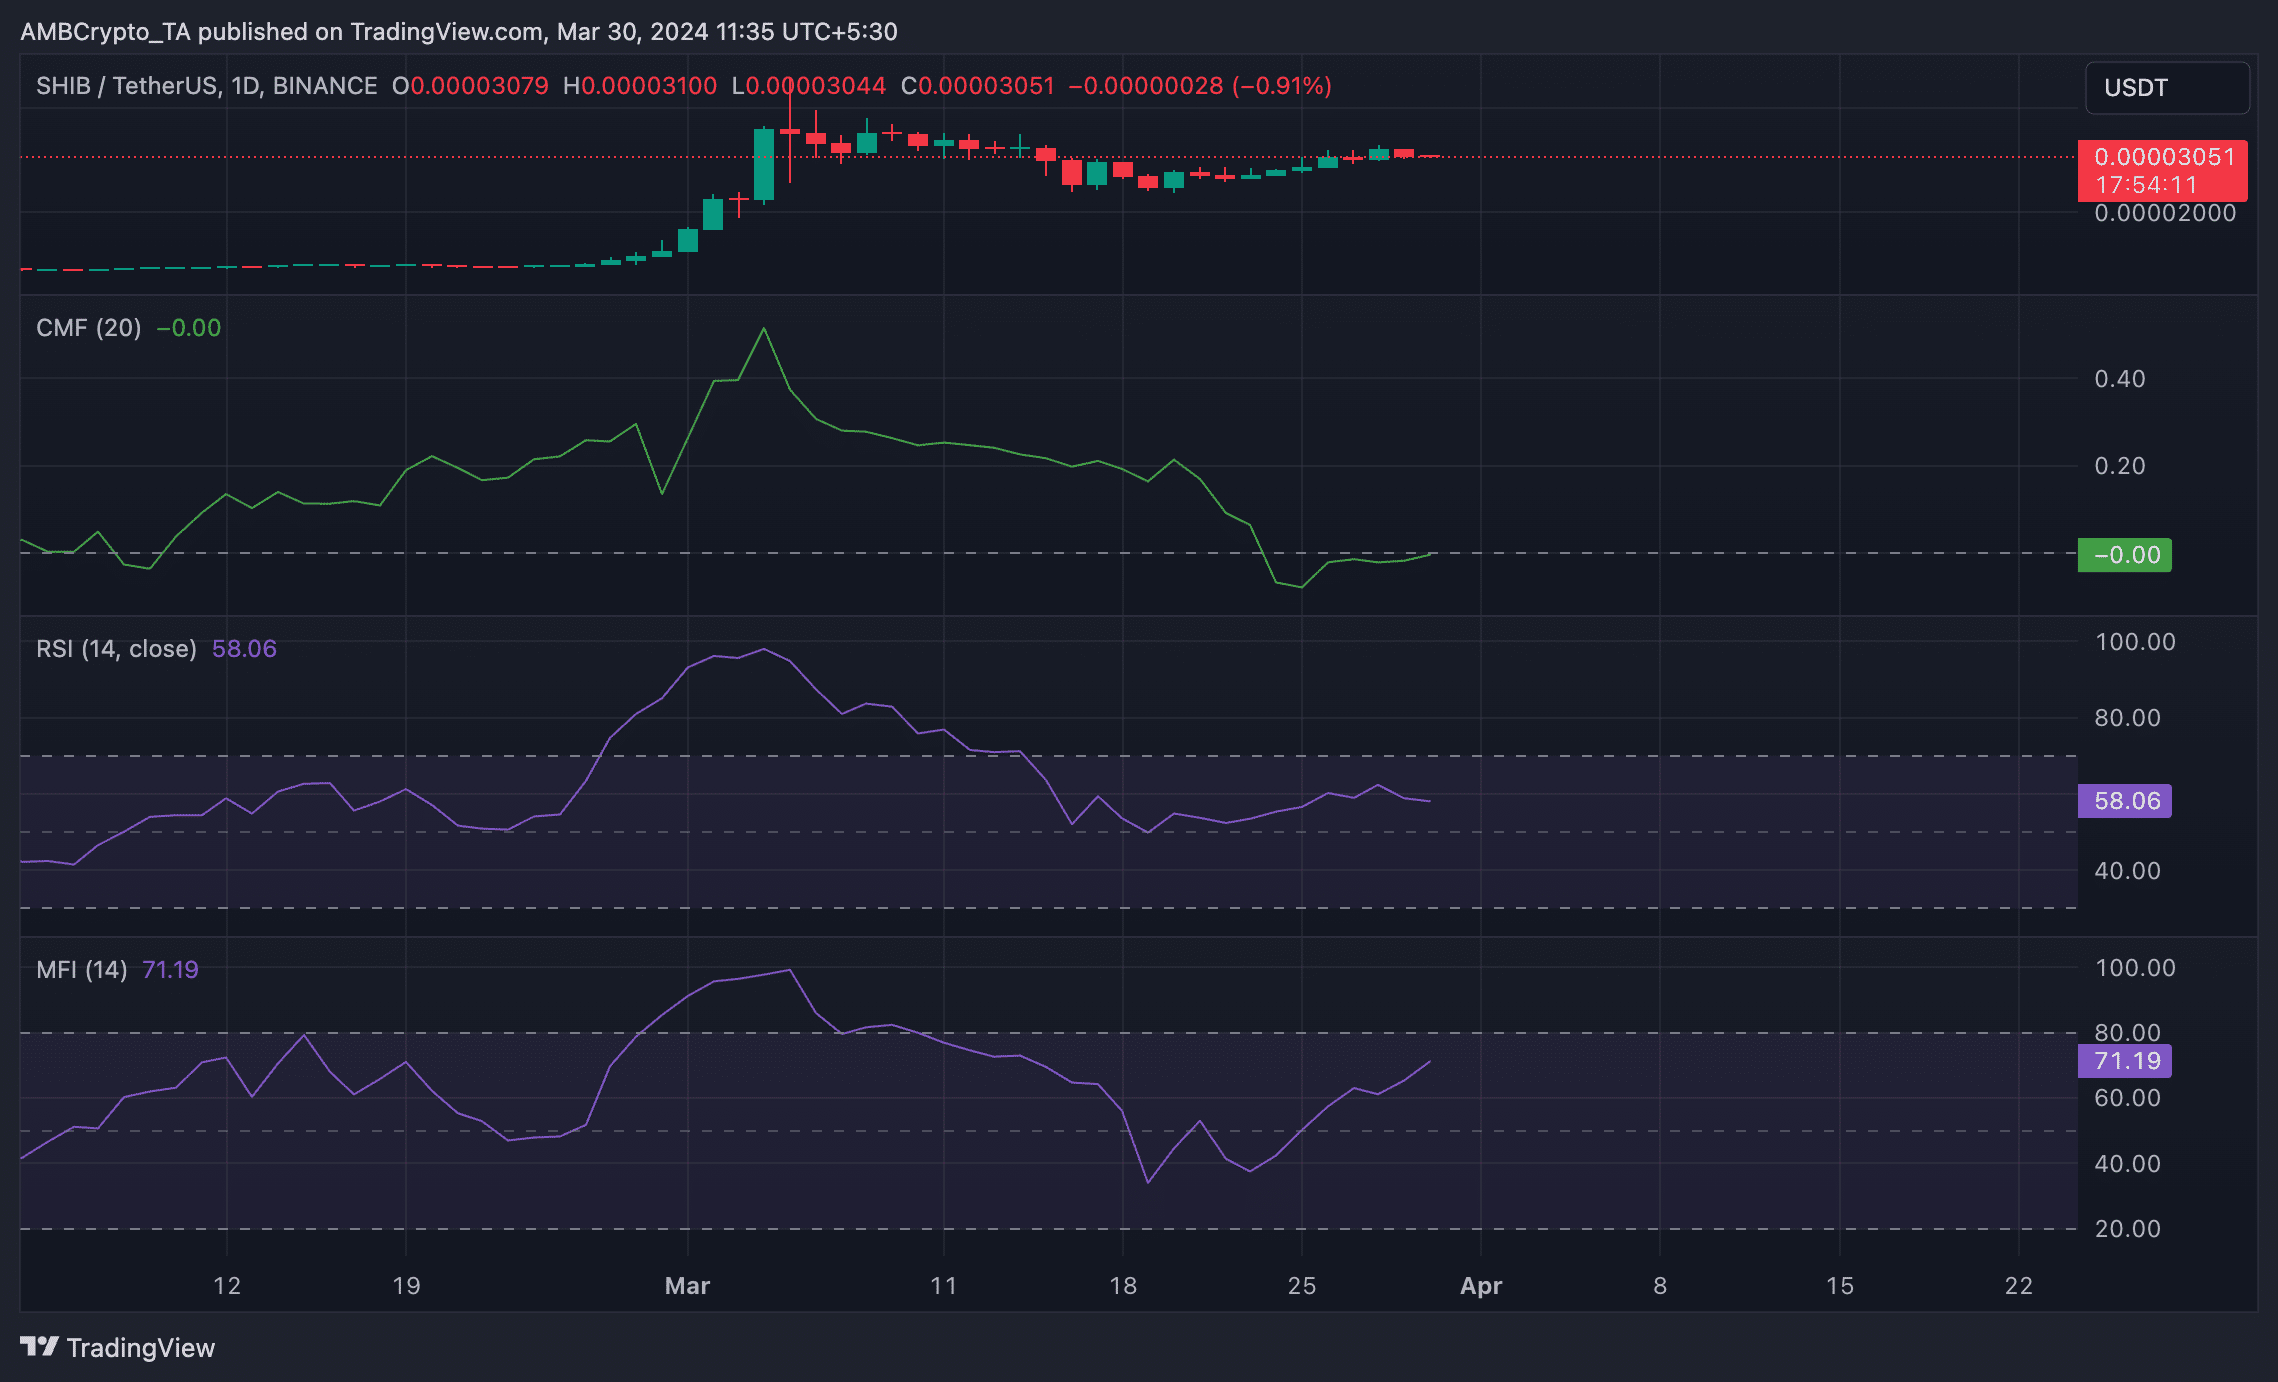 Source: SHIB/USDT on TradingView
Dogecoin whales bag 1.4 billion tokens: Will it flip DOGE price predictions?
2min Read
Dogecoin whales accumulated coins worth more than $280 million during the past few weeks, while the memecoin’s value surged.

- DOGE’s price surged by 33% in the last seven days.
- A few indicators hinted at a possible price correction.
Dogecoin [DOGE], the world’s largest meme coin, created a lot of buzz over the last few weeks as its price rallied substantially. Though there might be several factors that helped DOGE showcase this performance, one of the main reasons could be whale activity.
Dogecoin whales are hungry
The entire crypto market remained more or less bullish last week as Bitcoin [BTC] went above the $70k mark. But Dogecoin was the star of the show, as according to CoinMarketCap, the meme’s value surged by more than 33% in just the last seven days.
Meanwhile, Ali, a popular crypto analyst, posted a tweet highlighting an interesting development regarding DOGE whales. As per the tweet, whales purchased 1.40 billion DOGE over the past two weeks.
The worth of the bought coins was more than $280 million. This clearly indicated that the big players were confident in DOGE and expected the meme coin’s price to rise further in the coming days.
AMBCrypto’s analysis of Santiment’s data revealed that whale activity around DOGE continued to remain high during the last few days as well. This was evident from the massive rise in its whale transaction counts.
As the price increased, DOGE’s popularity rose as its social volume surged. The memecoin’s weighted sentiment also shot up on the 28th of March, suggesting that bullish sentiment around the meme coin was dominant in the market.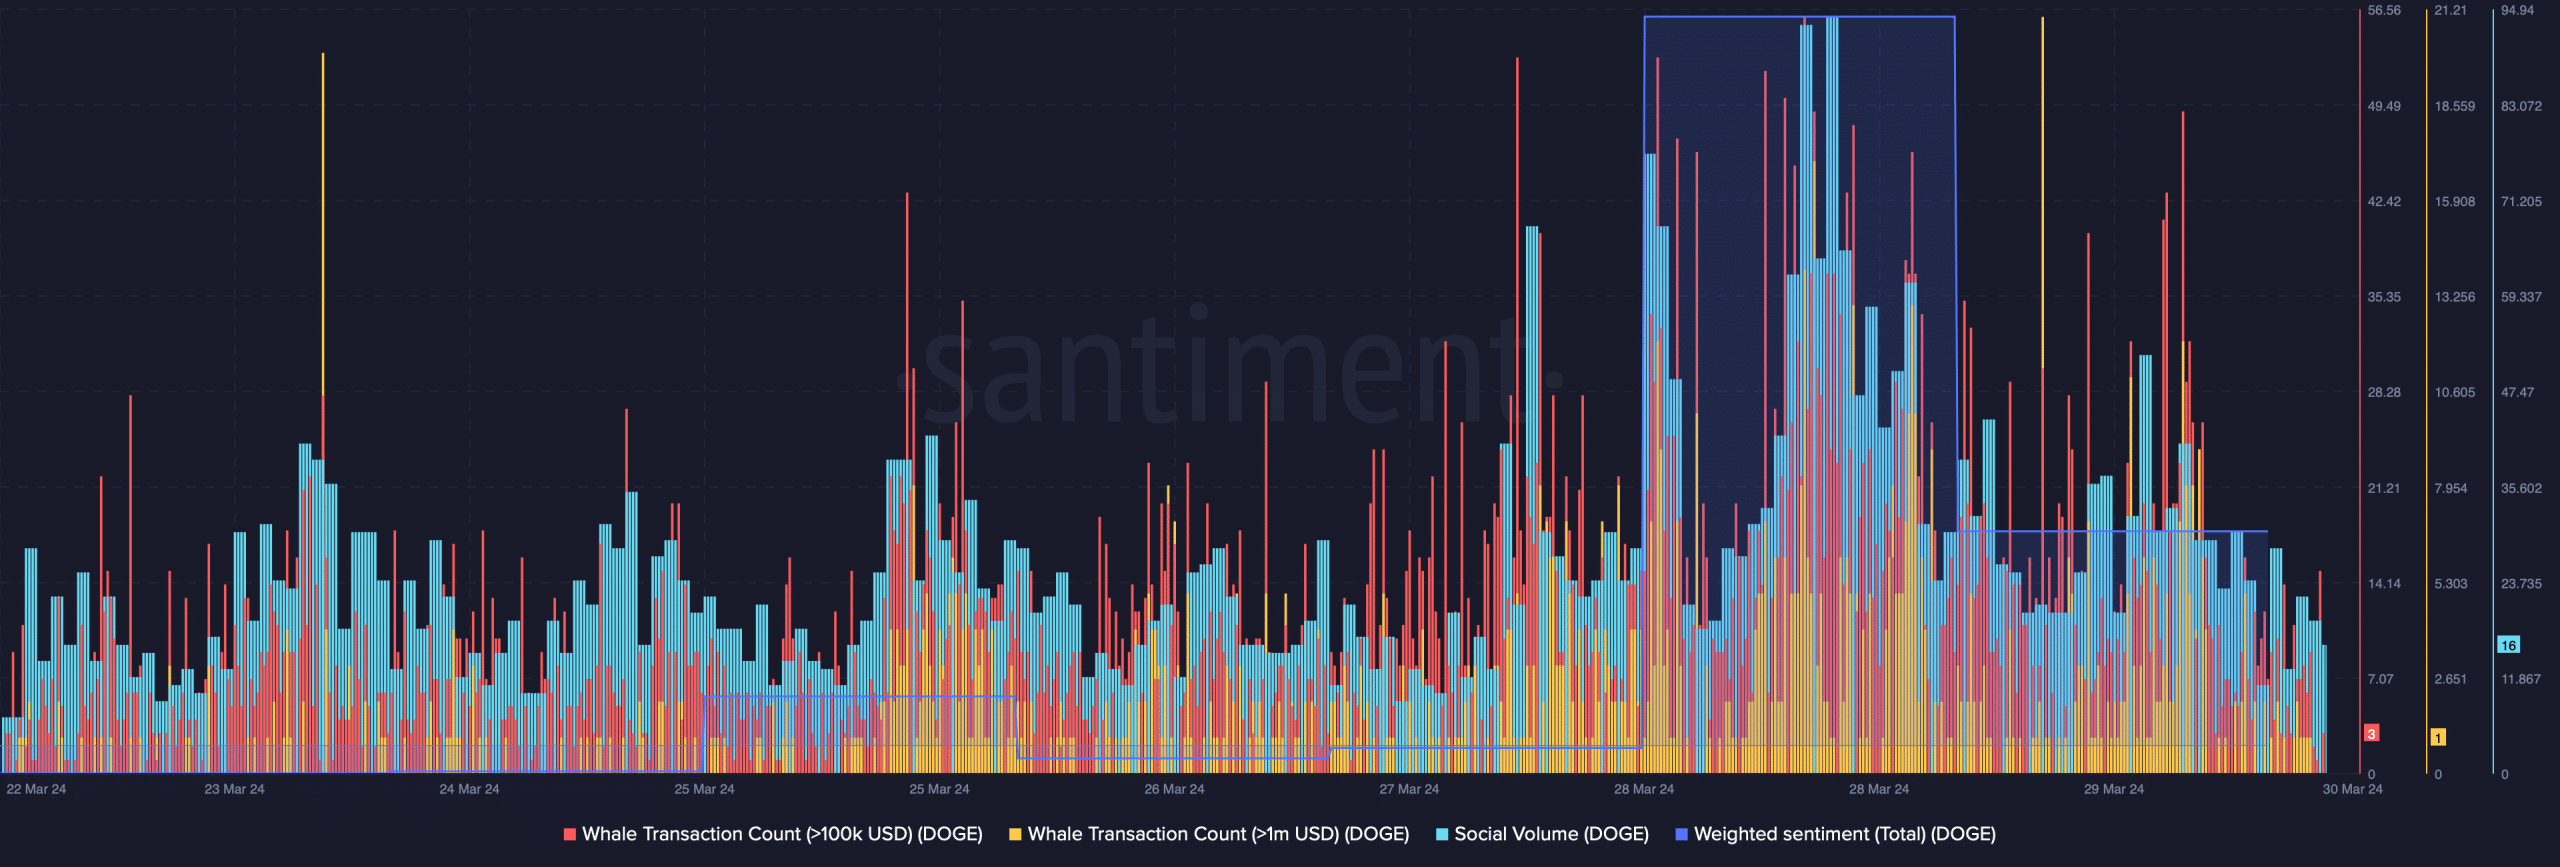 Source: Santiment
Is a trend reversal waiting?
Though the past week was bullish, Dogecoin’s daily chart turned red as its value went down slightly. According to CoinMarketCap, at the time of writing, DOGE was trading at $0.2138 with a market capitalization of over $30 billion, making it the 8th largest crypto.
To check if there could be a reversal, AMBCrypto took a closer look at DOGE’s metrics. We found that despite a short downtick, DOGE’s MVRV ratio continued to remain high.
Additionally, its funding rate was also green, meaning that derivatives investors were actively buying DOGE. 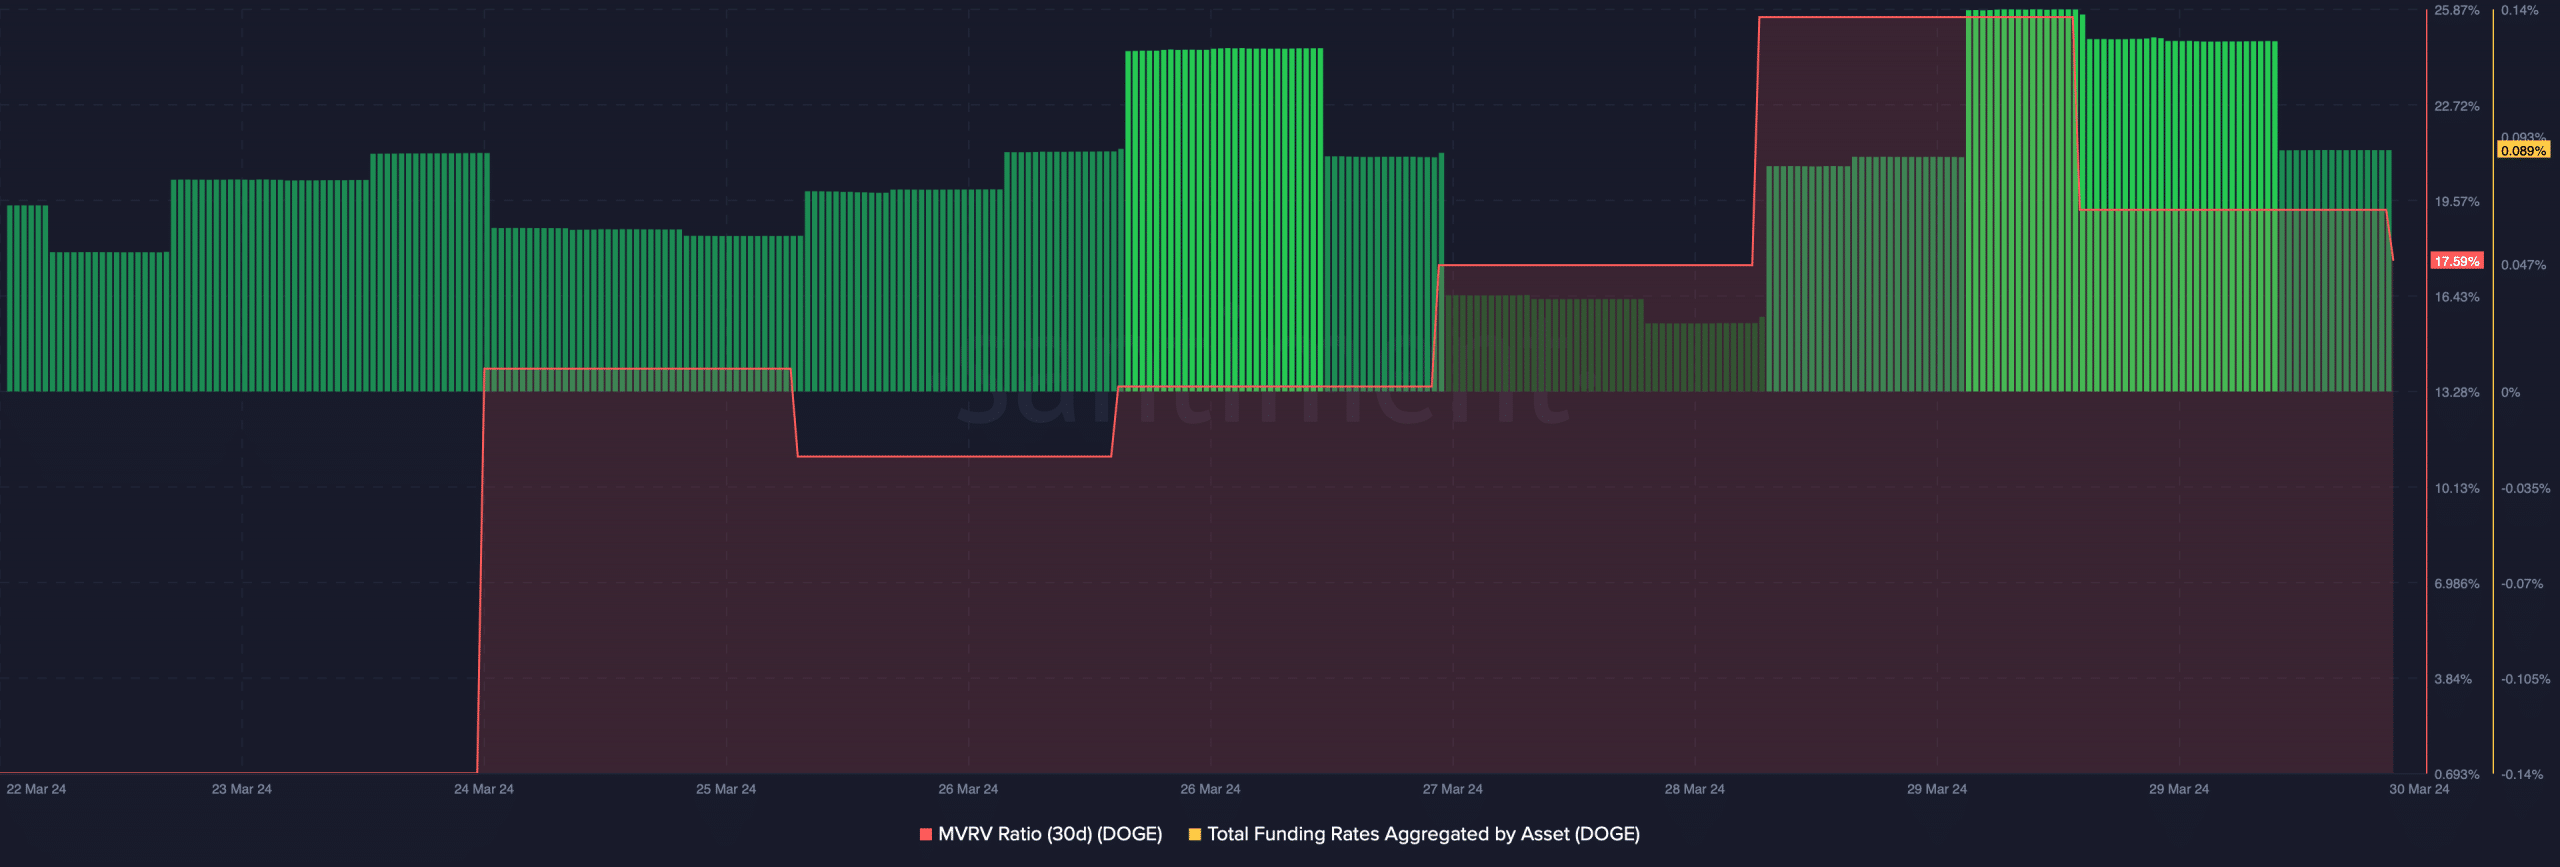 Source: Santiment
Read Dogecoin’s [DOGE] Price Prediction 2024-25
We then analyzed Dogecoin’s daily chart. Our analysis revealed that the technical indicator MACD displayed a clear bullish upperhand in the market.
However, the chances of a price correction can’t be ruled out as the Money Flow Index (MFI) had entered the overbought zone. This might increase selling pressure on the meme coin and in turn drop its price. 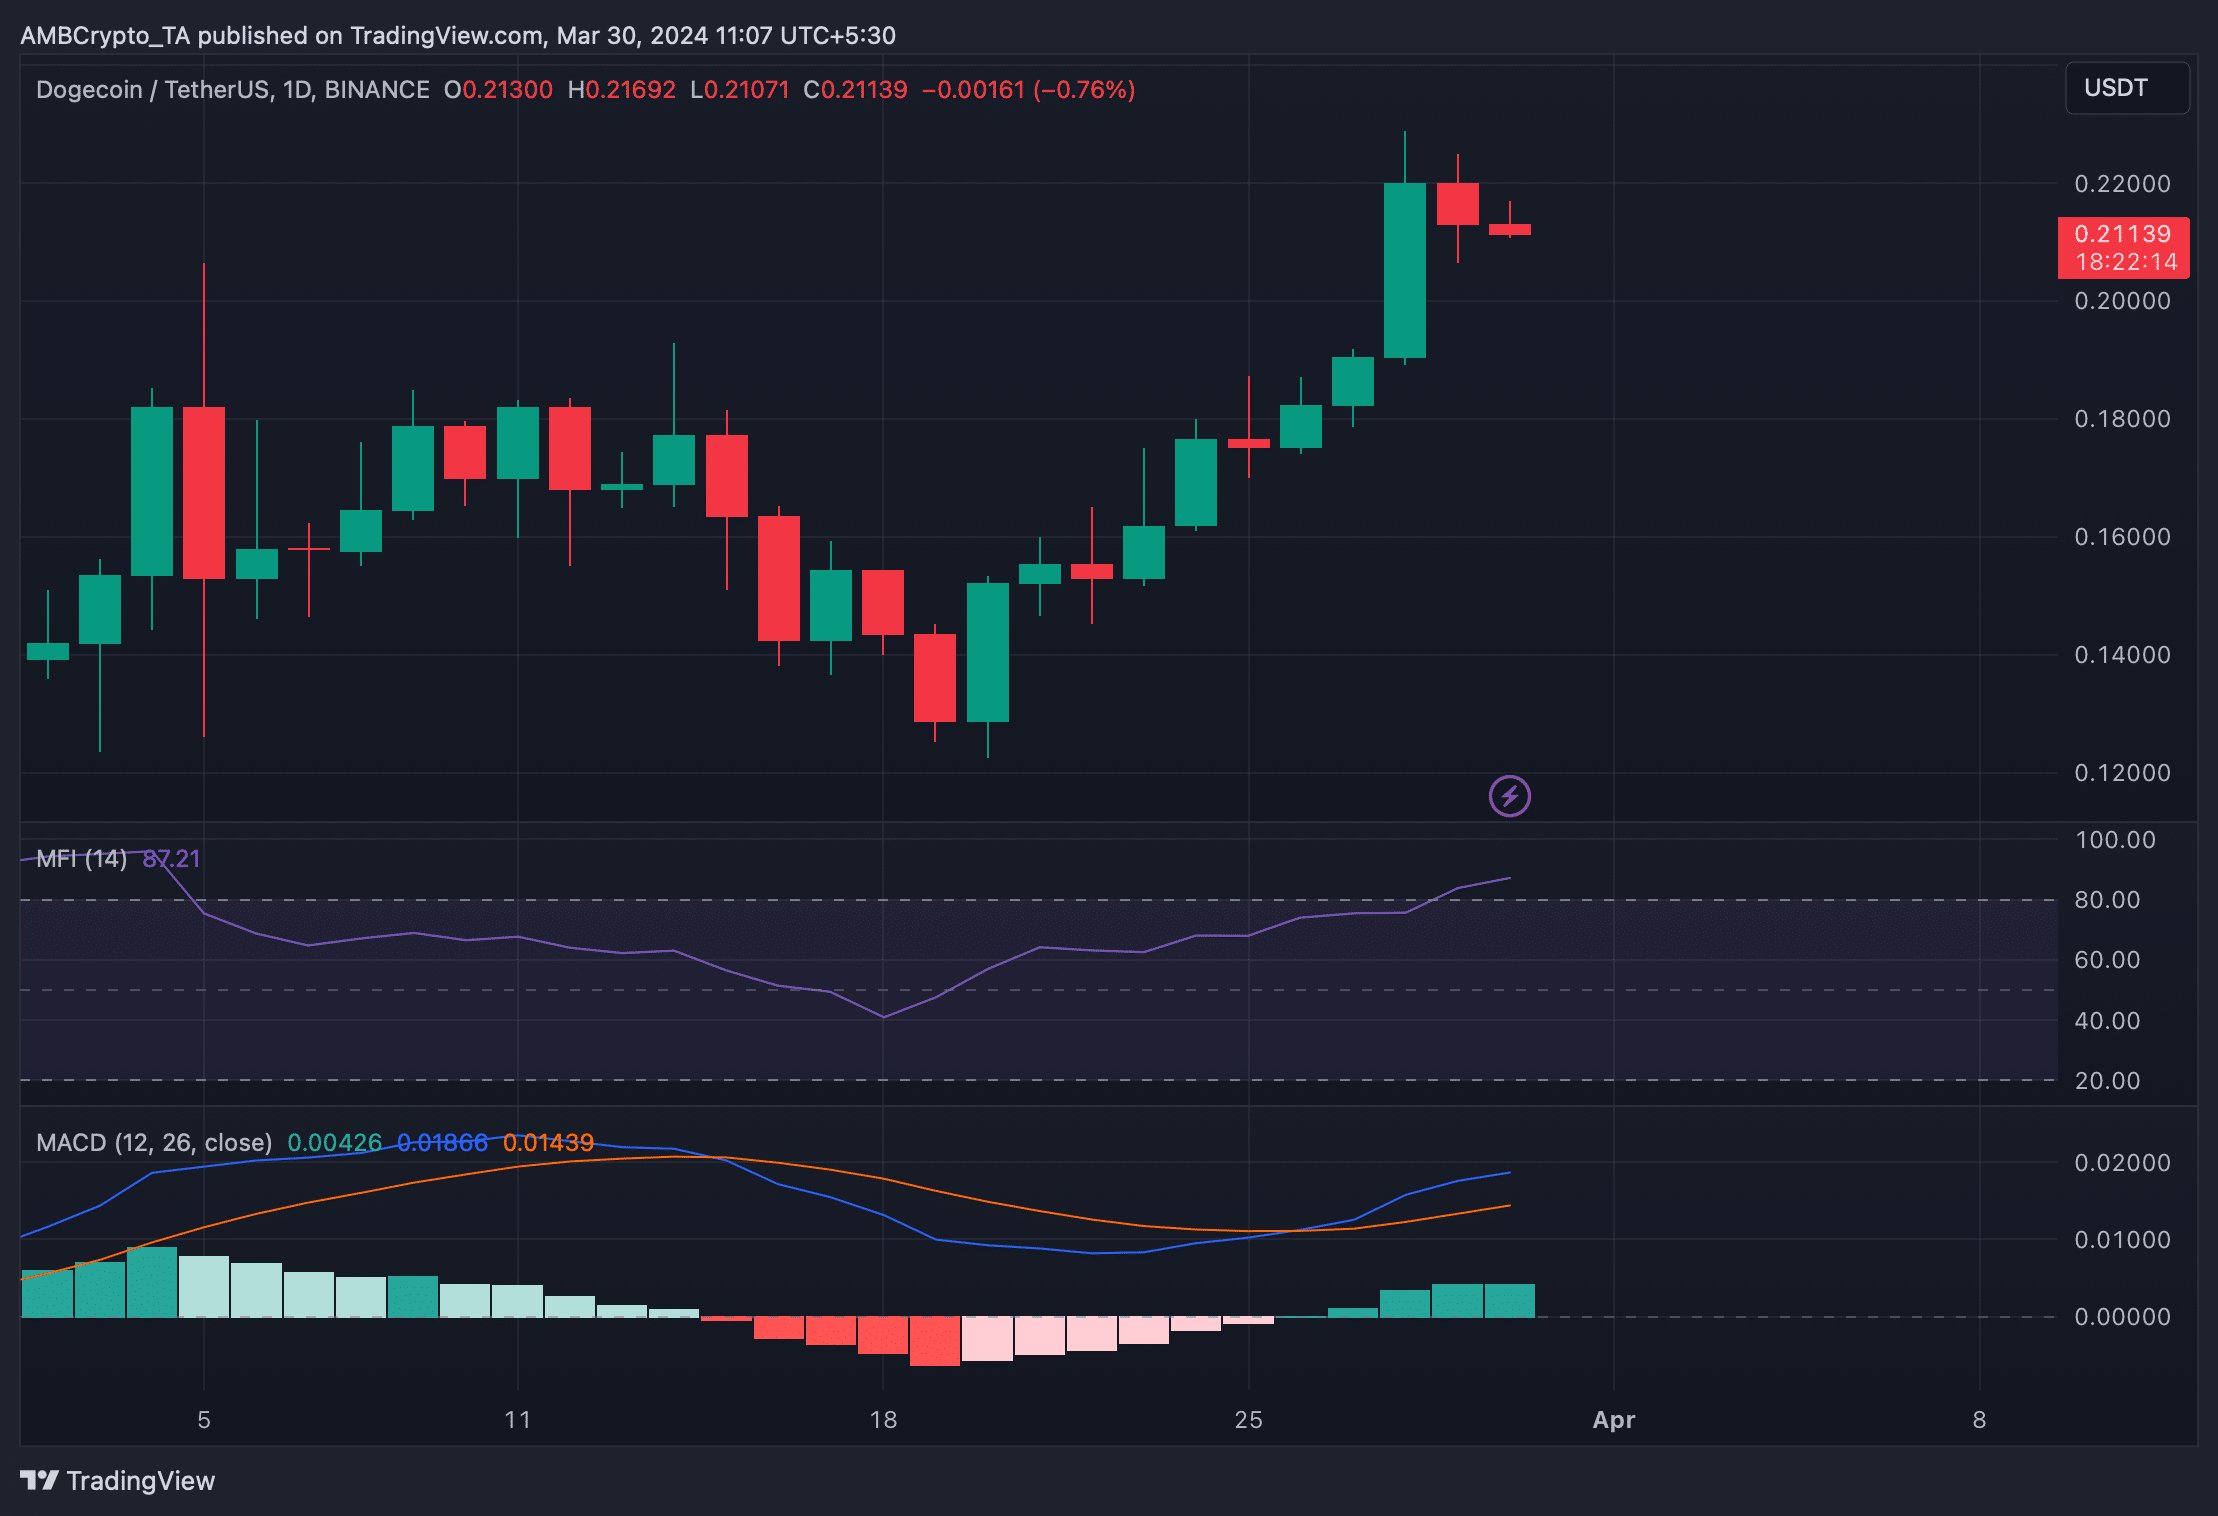 Source: TradingView
Previous: Shiba Inu [SHIB] is a success, what’s stopping Shibarium?
Next: Is HODLing XRP a good choice for this market cycle? Data says
Solana (SOL) Continues To Soar – How High Can It Go?
The Solana network’s native cryptocurrency, SOL, has been on an upward surge in the past three days, climbing from around $180 to over $210.
Having failed to break its previous low of $162.74, the coin, which is currently ranked 5th in the crypto market with a total supply of 441 million and a market capitalization of over $88 billion, SOL is showing no signs of stopping.
Will Solana Continue To Surge Upward?
At the time of writing, Solana has been up by 6.25% trading around $198 in the past 24 hours, and has broken above the previous resistance level of $195. The price is also trading above the 100-day moving average on the 4-hour chart of the SOL/USD pair. If the price continues to move upward, it might break above its major resistance level of $210 and move even higher to create a new high for the year.
All these can be seen in the image below: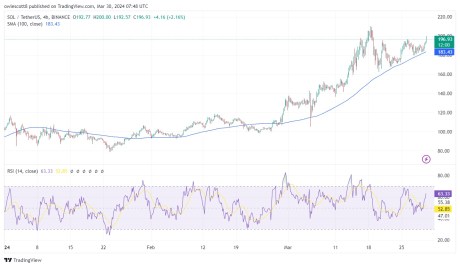 Looking at the chart with the help of the RSI (Relative Strength Index) indicator in the image above, we can see that the RSI line is trending above the 50 level. This is an indication that the price of SOL is still in a bullish zone and could even surge further upward.
A further look at the 4-hour timeframe chart with the help of the MACD indicator, we can see that the MACD is on the bullish side as the MACD line, the signal line, and the MACD histogram are all trending above the zero line.
Finally, using the bull vs bear power histogram indicator, it appears buyers have taken over the market with powerful momentum and are ready to push the price even higher.
We can confirm this in the image below: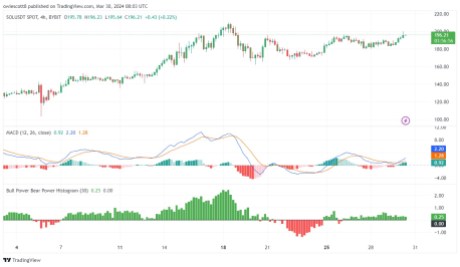 With the momentum that Solana is moving with, there is a possibility that it could break above its previous resistance level of $210.27. If this manages to happen we could see prices soaring higher especially with the level of demand momentum in the market
Could SOL Dip?
If the price of Solana fails to break above the resistance level of $210, it could start a downside correction to its initial support level of 162. If the price closes below this support level, it could decline even further and probably start a downward trend.SOL trading at $194 on the 1D chart | Source: SOLUSDT on Tradingview.com
Featured image from YouTube, chart from Tradingview.com
Disclaimer: The article is provided for educational purposes only. It does not represent the opinions of NewsBTC on whether to buy, sell or hold any investments and naturally investing carries risks. You are advised to conduct your own research before making any investment decisions. Use information provided on this website entirely at your own risk.