Bitcoin 2 Months Through “Euphoria Wave,” How Long Was The Last One?

On-chain data shows Bitcoin has been going through a “euphoria wave” for two months. Here’s how long it was in this phase during the last bull run.
Bitcoin Has Been In Euphoria Wave Phase According To Supply In Profit
According to the latest weekly report from the on-chain analytics firm Glassnode, the current BTC cycle is similar to the last one regarding the “Supply Profitability State.”
This indicator is based on the “Percent Supply in Profit,” which keeps track of the percentage of the total circulating Bitcoin supply that’s currently carrying a profit.
Related Reading: Dogecoin Slows Down: What Needs To Happen For New DOGE Highs?
This metric works by going through the on-chain history of each coin in circulation to see the price at which it was last transferred. Assuming that this last transaction was the last point at which it changed hands, the price at its time would reflect the coin’s current cost basis.
Naturally, if this cost basis is lower in value than the current spot price of the cryptocurrency, then the coin in question carries some net unrealized gain. The Percent Supply in Profit adds up all such coins and calculates what percentage of the supply they make up for.
The supply Profitability State signals BTC’s current phase based on the market’s profitability status. The chart below shows the trend in this indicator over the past few years.
Looks like the metric has been giving a green signal in recent weeks | Source: Glassnode's The Week Onchain - Week 15, 2024
In the chart, the analytics firm has highlighted three important lines for the Bitcoin Percent Supply in Profit. The middle line (colored in blue) represents the cumulative mean of the metric, while the other two signify +1 (green) and -1 (red) standard deviation (SD) from this mean.
When the Bitcoin Percent Supply in Profit is above the +1SD (approximately 95% of the supply being in the green), the market may be considered to be in the euphoria or pre-euphoria phase.
Similarly, the Supply Profitability State would indicate a bottom discovery phase for values less than -1SD. The zone between these two corresponds to the “bear/bull transition” phase.
From the chart, it’s visible that during the last bull run, Bitcoin first saw a 1.5-month-long pre-euphoria wave, during which the metric tested the +1SD line. The asset followed up with a period of decline and consolidation, which put the Supply In Profit back under the +1 SD mark.
Related Reading: Bitcoin Nears Two Important On-Chain Levels: What Happened Last Time
Finally, the coin observed a sharp rally, broke past the +1SD barrier, and went on to achieve new all-time highs, which naturally set the Supply In Profit to 100%.
Bitcoin seems to have witnessed a similar pattern this time around. A two-month-long pre-euphoria phase was followed by a drawdown, which has now been succeeded by a two-month-long euphoria wave during which the cryptocurrency has achieved new records.
If the euphoria wave lasts for a period similar to the last bull run, then four or more months might still be left for this Bitcoin bull rally.
BTC Price
Bitcoin had recovered above $72,000 earlier, but it appears that the asset has retraced back towards the $69,400 level.
The price of the asset appears to have gone through a drawdown over the last couple of days | Source: BTCUSD on TradingView
Featured image from iStock.com, Glassnode.com, chart from TradingView.com
Disclaimer: The article is provided for educational purposes only. It does not represent the opinions of NewsBTC on whether to buy, sell or hold any investments and naturally investing carries risks. You are advised to conduct your own research before making any investment decisions. Use information provided on this website entirely at your own risk.
Tags: bitcoinbitcoin bull runBitcoin CycleBitcoin EuphoriaBitcoin Euphoria Wave
“Where It Should Be”: Crypto Analyst Remains Firm On $1.7 Prediction For Cardano (ADA)

Investors and analysts are trying to predict Cardano’s (ADA) price’s future performance. As the price continues to show red numbers, a top crypto analyst considers that ADA is “right where it should be.”
Related Reading: ADA Price Ready To Soar As Cardano Network Hits New 88.6 Million Transaction Milestone
Cardano Loses 10th Spot Against Telegram’s Toncoin
Cardano’s recent spotlight has highlighted its disappointing price performance and lack of appeal for traders. Despite its technology and strong community, the ecosystem lacks the activity and demand of other chains like Solana.
Recently, Charles Hoskinson defended the project, stating that “Cardano always wins,” referencing a poll ranking the best Layer-1 networks. Moreover, Hoskinson took another jab at Solana’s network problem after its recent transaction failure rate reached 75%.
Nonetheless, on Tuesday, ADA lost its spot in the top ten cryptocurrencies after being flipped by Toncoin (TON). According to CoinGecko data, Cardano’s market capitalization of $20.1 billion was surpassed by TON’s $23.3 billion market cap. As a result, ADA’s spot as the 10th largest cryptocurrency by this metric was taken by TON.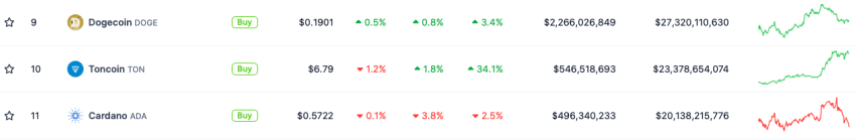
ADA drops to be the 11th biggest cryptocurrency by market cap. Source: CoinGecko
Per CoinMarketCap data, ADA remains in the top ten cryptocurrencies, ranking ninth on the website’s list before being flipped.
ADA Is “Where It Should Be”
Last week, crypto analyst Ali Martinez revealed that ADA’s whale activity was “experiencing a lull.” To the analyst, whether this was a signal of further price consolidation or a drop remained to be seen.
Some believe that TON’s overtaking of Cardano’s place on the list highlights some of the ecosystem’s problems. Martinez reiterated his prediction made around the time Bitcoin registered its latest all-time high (ATH) of $73,373. At the time, the analyst considered that ADA resembled the pattern observed from 2018 to 2021.
During the period observed by Martinez, Cardano’s token went through a long consolidation period, with the price hovering between $0.026 and $0.082. After breaking out of this resistance level, ADA’s price surged to $0.35 in the following weeks before continuing its upward trajectory to its ATH of $3.09.
According to the analyst, if that fractal continued during the following weeks, investors should “anticipate ADA consolidating in the $0.55 to $0.80 range. This would be followed by a surge to the $1.7 support level.
After another consolidation period, the stage would be set for the token’s price to “breakout to $5,” the analyst considered.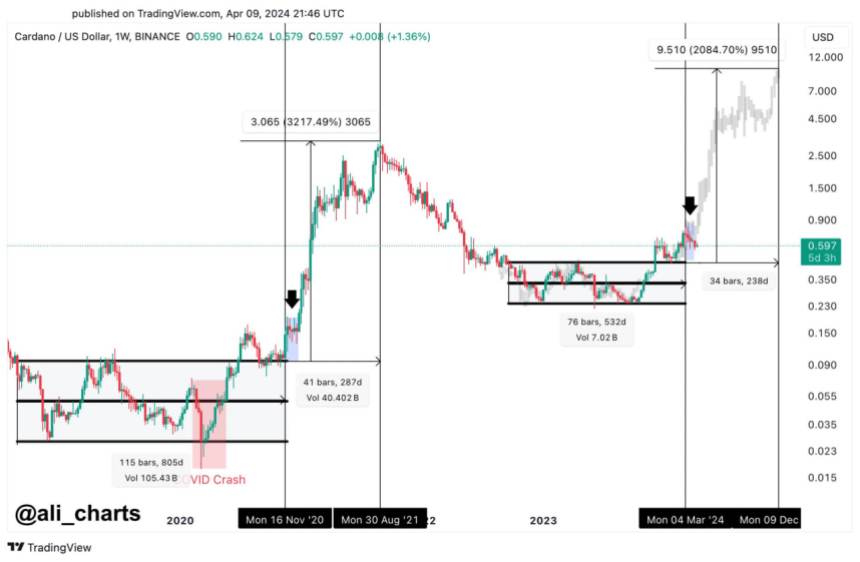 ADA’s price prediction and potential for fresh gains. Source: Ali Martinez on X
Almost a month later, the analyst considers that “nothing has changed for Cardano.” Martinez reaffirmed the price consolidation between the $0.55-$0.80 range and subsequent breakout, as “ADA is exactly where it should be.”
Despite the analyst’s optimistic forecast, ADA’s price of $0.5762 remains 81.5% below its 2021 ATH. At writing time, the token dropped 5.4% from the previous day. Additionally, its performance has decreased by 3.6% and 22.3% in the weekly and monthly timeframes.
However, the token’s market activity has surged 6.6% in the last 24 hours, with a daily trading volume of $502.1 million.
Related Reading: Solana Open Interest Drops $370 Million Amid Network Troubles, $200 Still Possible?
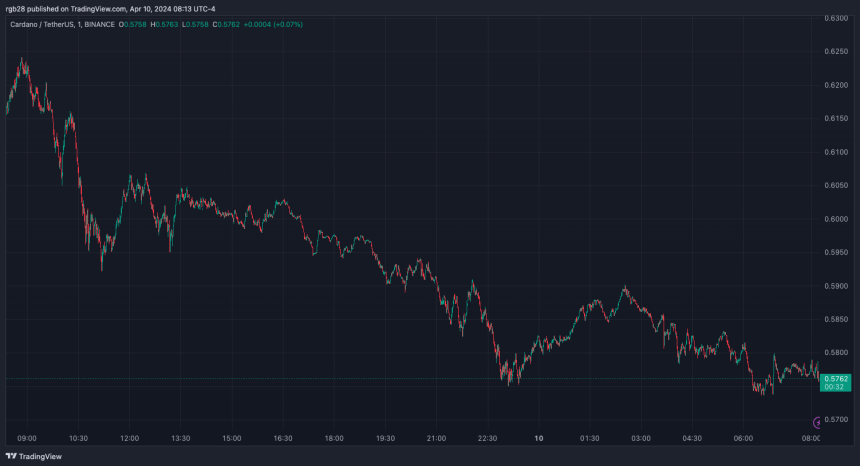
ADA's performance in the 1-day chart. Source: ADAUSDT on Tradingview
Featured Image from Unsplash.com, Chart from TradingView.com
Disclaimer: The article is provided for educational purposes only. It does not represent the opinions of NewsBTC on whether to buy, sell or hold any investments and naturally investing carries risks. You are advised to conduct your own research before making any investment decisions. Use information provided on this website entirely at your own risk.
Tags: ADAADA priceADAUSDTCharles Hoskinsoncrypto analysttelegramTON
Bitcoin Tumbles on Hot CPI Data, But This Analyst Stays Ultra Bullish: Here’s Why
The better-than-expected United States Consumer Price Index (CPI) released on April 10 is already sending shock waves through the financial market. Bitcoin and most crypto assets are trading lower, extending losses recorded on April 9, weighing negatively against optimists.
United States CPI Data Came In Hot
According to Trading Economics data on April 10, CPI, a key economic metric for gauging inflation, rose 0.4% in March, pushing the annual inflation rate to 3.5%. Notably, this surpassed economist predictions and, most importantly, dashed hopes for the United States Federal Reserve (Fed) to slash rates aggressively this year.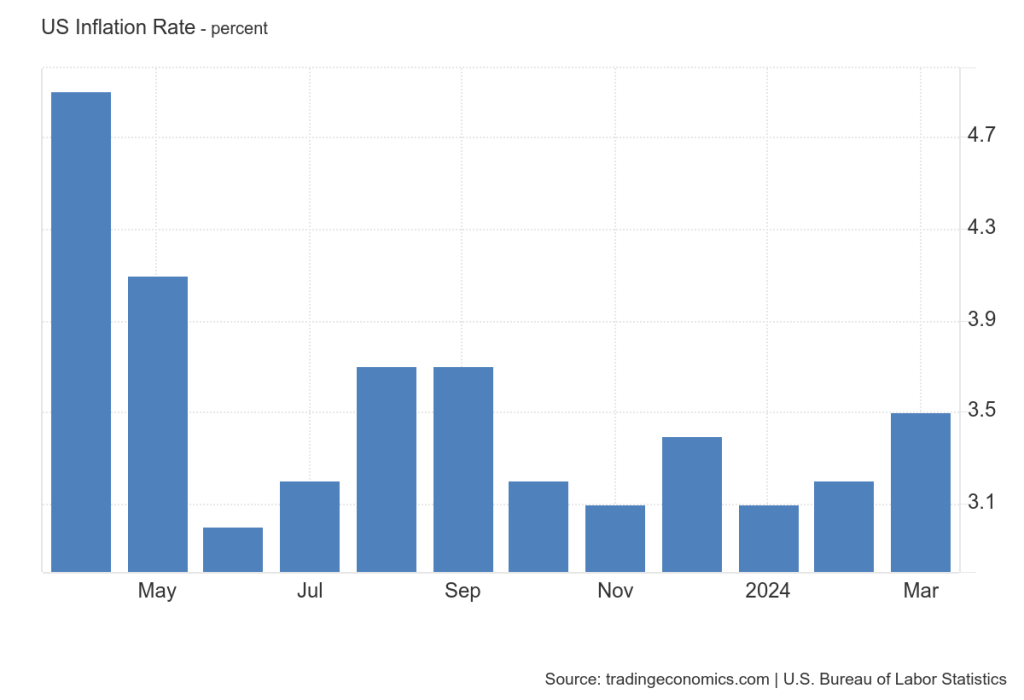 United States CPI data | Source: Trading Economics
However, amidst the market jitters, Matt Hougan, the CIO of Bitwise Asset Management, offered a contrarian perspective as fear permeated the Bitcoin and crypto market. In a post on X, Hougan downplayed the influence of the CPI data on Bitcoin’s long-term trajectory.
Related Reading: XRP Heading To $100-$500? Analyst Provides Speculated Timeframes
The executive argues that investors and traders should track other market factors like spot Bitcoin exchange-traded fund (ETF) inflows and rising government deficits. In Hougan’s assessment, these can strongly influence price, even lifting Bitcoin higher since they are currently aligned.
Time To Buy The Bitcoin Dip?
As such, even with the fall in BTC, the drop could offer potential buying opportunities for long-term holders. Some supporters believe the “hot” CPI data only exposes the vulnerabilities of fiat currencies. This would potentially drive investors to use Bitcoin as a hedge.
Moreover, this upbeat sentiment is backed by solid demand for gold, a store of value asset preferred by traditional finance investors. Analysts anticipate Bitcoin will follow a similar path as investors seek to protect value amid rising inflation.
Further bolstering the bullish sentiment is the possibility of a spot Bitcoin ETF launch in Hong Kong before the end of April.
The Hong Kong Securities and Futures Commission (SFC) has been assessing various applications. Leading Chinese asset managers have submitted some. If the product is approved, it could further channel more capital to BTC, boosting inflows from the United States.Bitcoin price trending sideways on the daily chart | Source: BTCUSDT on Binance, TradingView
When writing, BTC is steady but under pressure. April 9’s losses have been confirmed. The coin might track lower if bulls fail to push prices above all-time highs of around $74,000.
Related Reading: Analyst Says Bitcoin Halving Influence Is No Longer Driving Price, Here’s What Is
Bitcoin remains in a broader bullish formation, technically moving inside a rising wedge. This bullish outlook will only be invalidated if prices tank below $61,500 in the sessions ahead.
Feature image from DALLE, chart from TradingView
Disclaimer: The article is provided for educational purposes only. It does not represent the opinions of NewsBTC on whether to buy, sell or hold any investments and naturally investing carries risks. You are advised to conduct your own research before making any investment decisions. Use information provided on this website entirely at your own risk.
Changing Tides: Restaking Takes Center Stage In Ethereum (ETH) Staking Landscape
In recent months, the Ethereum staking landscape has witnessed significant transformations, prompting a shift in investor preferences and reshaping the sector’s dynamics.
According to on-chain data researcher and strategist at 21Shares, Tom Wan, key metrics indicate a notable change in the approach towards Ethereum staking, with restaking gaining prominence as a preferred method.
Ethereum Restaking Landscape
Wan’s observations, shared on the social media platform X (formerly Twitter), highlight a steady increase in ETH staking deposits from restaking, rising from 10% to 60% since 2024. ![]()
Restaking can be accomplished in two primary ways: through ETH natively restaked or by utilizing a liquid staking token (LST). By staking their ETH, users secure additional applications known as Actively Validated Services (AVS), which yield additional staking rewards.
A significant player in the staking landscape is EigenLayer, which has emerged as the second-largest decentralized finance (DeFi) protocol on the Ethereum network.
Related Reading: Are The Odds In Bitcoin Bulls Favor? These Analysts Forecast BTC’s Future
EigenLayer has achieved a significant milestone with the release of EigenDA, its data availability Actively Validated Service (AVS), on the mainnet.
According to a research report by Kairos, this launch marks the beginning of a new era in restaking, where liquid restaking tokens (LRTs) will become the dominant way for restakers to do business.
Currently, 73% of all deposits on EigenLayer are made through liquid restaking tokens. The report highlights that the growth rate of LRT deposits has been significant, increasing by over 13,800% in less than four months, from approximately $71.74 million on December 1, 2023, to $10 billion on April 9, 2024, demonstrating the growing confidence in EigenLayer’s approach to restaking and contributing to the shifting tides in Ethereum’s staking landscape.
According to Wan, the rise of liquid restaking protocols has also contributed to a decline in the dominance of Lido (LDO), a staking service solution for Solana (SOL), Ethereum, and Terra (LUNC).
On the other hand, Etherfi has emerged as the second-largest stETH withdrawer, with 108,000 stETH withdrawn through the first quarter of 2024. This trend exemplifies the increasing popularity of liquid restaking protocols, allowing stakers to withdraw and actively utilize their staked assets while still earning rewards.
Ether.fi Set To Surpass Binance In ETH Staking
Data provided by Wan also shows a decline in the dominance of centralized exchanges (CEXs) in ETH staking. Since 2024, CEXs have seen their share of staking decline from 29.7% to 25.8%, a significant drop of 3.7%.
As a result, the decentralized staking provider Kiln Finance has surpassed Binance and become the third-largest entity in terms of ETH staking. With Ether.fi poised to follow suit, it is expected to surpass Binance’s position shortly, according to the researcher.
Related Reading: Crypto Experts Predict Massive Price Surge For XRP Price, Is $20 Possible?
In short, these developments signify a paradigm shift in the Ethereum staking landscape, with re-staking methodologies gaining traction and decentralized protocols like EigenLayer and Ether.fi challenging the dominance of established players. The 1-D chart shows ETH’s price volatility for the past few days. Source: ETHUSD on TradingView.com
As of this writing, ETH’s price stands at $3,500. It has been exhibiting a sideways trading pattern over the past 24 hours, remaining relatively stable compared to yesterday.
Featured image from Shutterstock, chart from TradingView.com
Disclaimer: The article is provided for educational purposes only. It does not represent the opinions of NewsBTC on whether to buy, sell or hold any investments and naturally investing carries risks. You are advised to conduct your own research before making any investment decisions. Use information provided on this website entirely at your own risk.
Tags: blockchaincryptocryptocurrencyDeFiETHETH staking


![[ℕ𝕖𝕧𝕖𝕣] 𝕊𝕖𝕝𝕝 𝕐𝕠𝕦𝕣 𝔹𝕚𝕥𝕔𝕠𝕚𝕟 - OM(G) , My Biggest Bag Was A Scam????](https://cdn.bulbapp.io/frontend/images/99de9393-38a8-4e51-a7ab-a2b2c28785bd/1)


![[LIVE] Engage2Earn: Doubling down on Dickson](https://cdn.bulbapp.io/frontend/images/0dea4715-4791-404e-acff-82013adb11e1/1)


