My Take on Coursera Google Data Analytics Professional Certification Program

![]()
In today's data-driven world, the ability to extract meaningful insights from information is a skill in high demand. Data analysts are the wizards behind the curtain, transforming raw data into actionable intelligence that fuels better decision-making across industries.
Recognizing this growing need, I recently enrolled in a data analytics certification program offered by Coursera, generously sponsored by the government. This program builds upon the foundation I discussed in my previous article. You can acess the previous article through this link. By delving deeper into the specific techniques and tools used to wrangle and analyze data.
Components of Data Analytics Certification
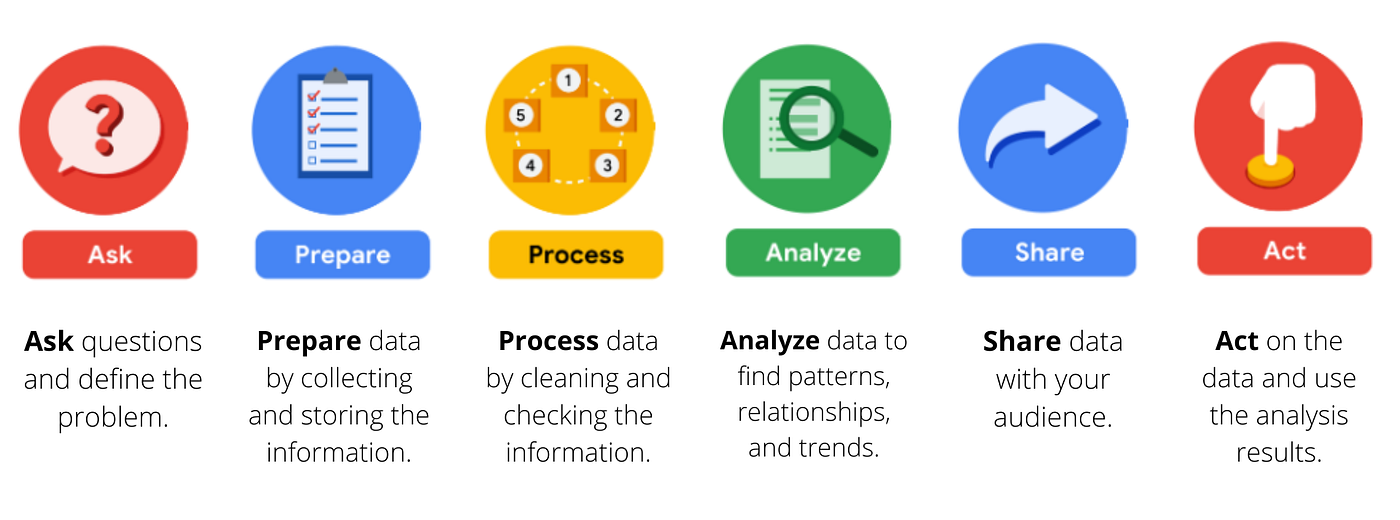
The certification program is divided into 8 components, each designed to equip you with the skills needed to navigate the data analysis lifecycle. These components typically include 4-6 modules that provide a step-by-step guide for tackling real-world data challenges. Here's a breakdown of what I've learned so far, along with my feedback as an IT graduate:
1. Foundation: The Cornerstone of Data Analysis
This core component provides a comprehensive introduction to the exciting world of data analytics. Here's a deeper dive into what you'll likely encounter:
- The Data Analytics Landscape: Explore the various applications of data analytics across different industries, from healthcare and finance to marketing and social media. Gain a clear understanding of the growing demand for data-driven insights in today's world.
- Essential Skills for Success: This section delves into the key skills required to thrive as a data analyst. You'll likely learn about critical thinking, problem-solving, communication, and collaboration skills, all essential for turning data into actionable results.
- Data Terminology Demystified: The program equips you with a solid foundation in data analysis terminology. You'll explore core concepts like data types, data collection methods, data quality principles, and the data analysis lifecycle, ensuring you can navigate the world of data with confidence.
2. Ask: Sharpening Your Questioning Skills
This emphasizes the crucial first step of any data analysis project: asking the right questions. Here's how the program might guide you:
- The Power of Why: This section dives deep into the importance of asking "why" and formulating insightful questions that drive your analysis. You'll learn techniques for identifying the root cause of problems and framing questions that will yield actionable insights.
- Defining Success: The program emphasizes the importance of clearly defining the desired outcome of your analysis before diving into the data. This ensures your questions are aligned with your overall goals and the data you collect will be relevant to uncovering the information you need.
- Thinking Like an Analyst: Here, you'll develop your analytical thinking skills by practicing how to break down complex problems into smaller, more manageable questions. This critical skill allows you to approach data challenges with a structured and focused mindset.
3. Prepare: Data Wrangling 101
Following the crucial questioning phase, you'll move on to data preparation, the foundation for impactful analysis. Here's a more detailed look at what you might learn:
- Data Acquisition Strategies: This section explores various methods for acquiring data, depending on the project requirements. You'll learn about accessing existing datasets, conducting surveys, and web scraping techniques for gathering data from online sources.
- Data Quality Control: The program emphasizes the importance of data quality for reliable analysis. You'll delve into techniques for identifying and addressing data inconsistencies, missing values, and outliers to ensure your data is clean and ready for analysis.
- Data Sampling Techniques: Not all data is created equal. This section introduces you to data sampling techniques, allowing you to extract a representative subset of data for analysis when dealing with large datasets. You'll learn about various sampling methods, such as random sampling and stratified sampling, and how to choose the most appropriate technique for your specific needs.
4. Process: Taming the Raw Data
This component equips you with the tools and techniques for cleaning and transforming your raw data. Data in its natural state can be messy and inconsistent. Here, you'll learn how to handle missing values, identify and address errors, and ultimately transform your data into a usable format for analysis. The program delves into various data cleaning methods, providing you with a powerful arsenal for tackling messy data. You'll explore:
- Excel Functions and Formulas: Master the art of data manipulation using built-in Excel functions and formulas. Learn to remove duplicates, format data consistently, address missing values, and extract specific information using powerful tools like VLOOKUP, SUMIFS, and TEXT. SQL for
- Data Wrangling: This section introduces you to the fundamentals of SQL, a structured query language that allows you to efficiently interact with and manipulate data stored in relational databases. You'll gain the ability to filter data based on specific criteria, sort and organize information, and ultimately extract the precise data subset required for your analysis.
By working with both Excel and SQL, you've undoubtedly seen a significant improvement in your spreadsheet and SQL skills. These valuable tools will empower you to handle complex datasets confidently and prepare them for insightful analysis.
5. Analyze: Unveiling the Hidden Insights
This highly anticipated section focuses on the heart of data analysis: extracting meaningful insights from your prepared data. You'll delve into various statistical methods and analytical techniques to uncover patterns, trends, and correlations within the data. The program elevates your spreadsheet and SQL skills to a whole new level, equipping you with powerful tools for uncovering deeper insights. Here's what you'll encounter:
- Advanced Excel Analysis: This section introduces you to PivotTables, a robust tool in Excel that allows you to summarize and analyze large datasets efficiently. You'll learn how to customize pivot tables to suit your specific needs, filter data, and create insightful visualizations that reveal hidden patterns within your data.
- Advanced SQL Techniques: The program dives into more advanced SQL concepts like nested queries (subqueries) and temporary tables. Subqueries allow you to embed one query within another, unlocking the ability to perform complex data manipulations and extract even more granular insights from your data. Temporary tables provide a flexible way to store and manipulate results within your analysis, further enhancing your data exploration capabilities.
These advanced techniques likely left you amazed, especially if subqueries were a new concept. Mastering these tools significantly strengthens your SQL and spreadsheet skills, allowing you to tackle complex datasets with greater confidence and efficiency. You're well on your way to becoming a skilled data analyst!
6. Share: The Art of Data Storytelling
The final stages of your data journey involve effectively communicating your findings to a wider audience. This component teaches you how to translate your analysis into compelling data visualizations and clear, concise reports that resonate with both technical and non-technical stakeholders. Get ready to unleash your inner data storyteller! This section equips you with the essential tools and techniques to transform your insights into impactful narratives:
- Data Visualization with Tableau and R: The program introduces you to popular data visualization software like Tableau and R. These powerful tools allow you to create interactive dashboards, charts, and graphs that effectively communicate complex data stories to any audience. You'll learn how to harness the visual power of these tools to make your findings clear, engaging, and actionable.
- Choosing the Right Chart: Beyond the technical aspects of creating visualizations, this section delves into the art of selecting the most appropriate chart type for your data and storytelling goals. You'll explore various chart options, from bar charts and pie charts to heatmaps and scatter plots, and gain valuable insights into when and how to use each one to maximize the impact of your data story.
By the end of this component, you'll be well-equipped to craft compelling data visualizations that not only showcase your findings but also engage your audience and drive informed decision-making.
Looking Ahead
With two components remaining, I'm nearing the finish line! The final stretch dives into advanced data analysis techniques like predictive modeling and data visualization best practices, solidifying my skillset. But the journey doesn't stop at creating compelling visualizations. The next stage, often called the "Act" phase, focuses on translating insights into action. I'll learn to communicate my findings to stakeholders, ensuring they understand the data story and can take informed actions based on my analysis.
Finally, the program equips me for future success. This might involve building a portfolio that showcases my newfound skills through a capstone project or other practical applications. This portfolio becomes a powerful tool to demonstrate my capabilities to potential employers, launching me into the data analytics job market with confidence. By the program's end, I'll be armed with not only theoretical knowledge but also the practical skills to transform data into actionable insights that drive real-world results.
Conclusion
The Google Professional Certificate on Data Analytics has been an amazing journey for me as an aspiring data analyst. This program offers a structured path, covering the entire data analysis lifecycle from foundational concepts to advanced techniques like using Tableau and R. Each component, from asking the right questions to data wrangling and analysis, played a crucial role in building my skills.
The beginner-friendly format, with clear learning materials and additional resources, allowed me to grasp the concepts even with no prior experience. I'm impressed by the depth of knowledge I've gained, especially the improvement in my spreadsheet and SQL proficiency. Now, I'm eager to dive into the final sections and explore data visualization tools, further solidifying my data analysis skillset. This certification is a launchpad for my continued exploration in this exciting field, and I'm confident I can use these skills to tackle real-world data challenges and contribute to data-driven decision making.