The Best Trend Indicators For Trading In 2023 ( part 3 , RSI , OBV , PSAR )

#3 – The Relative Strength Index (RSI) Indicator
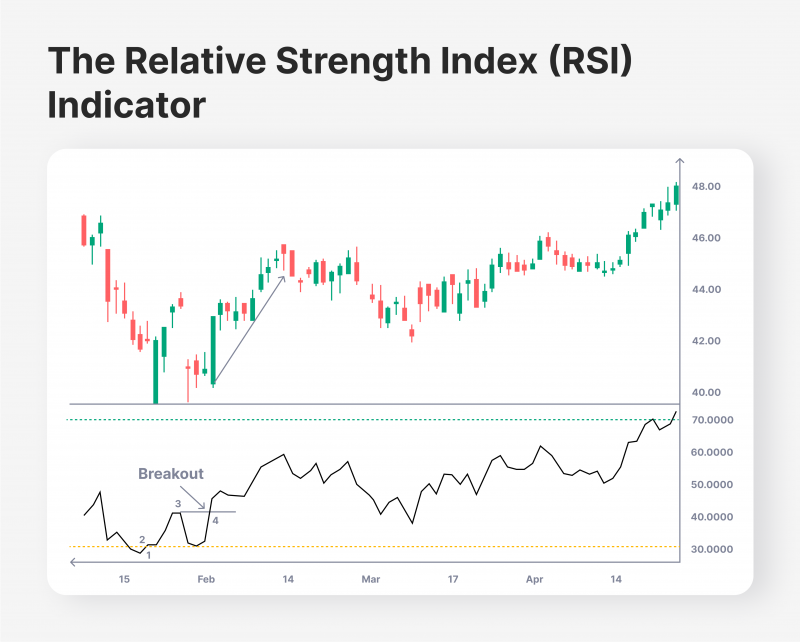 The RSI indicator is quite similar to the MACD, as it also calculates the average price of an asset over some time to identify potential trading opportunities. However, the RSI calculation is considerably different from the MACD model. RSI indicator calculates the recent price momentum swings in the last 14 periods for a particular asset. RSI is calculated by dividing the last 14-period gains by the respective 14-period losses. As a result, investors receive a clear picture of the recent trading momentum for the asset at hand.
The RSI indicator formula yields a 0 to 100 ratio. If the RSI ratio is above 70, the underlying asset is overbought in the last 14 periods. Thus, it might be a good idea to start selling the asset shortly, as the market is bound to correct the excessive purchasing trend. Conversely, an RSI indicator below 30 signals that the asset has been oversold in recent periods. Therefore, it might be time to consider purchasing this asset while the value is relatively low.
While the RSI is another effective indicator, it can be misleading when utilised separately. After all, assets might be overbought or oversold for a good reason, and the RSI indicator alone is not enough evidence to counter the market momentum. Thus, it is an excellent strategy to combine the RSI with the MACD model and compare the findings from the two indicators.
#4 – The On Balance Volume (OBV) Indicator
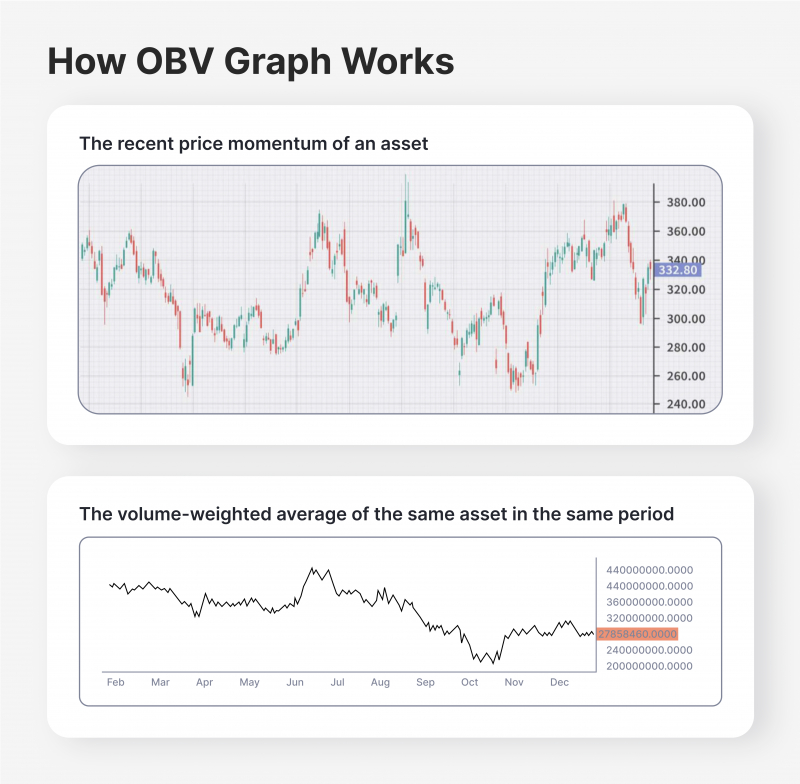 While the price swings for tradable assets can be measured and analysed in detail, there is one variable that traders should carefully consider – the volume of the recent buying or selling trends. The OBV indicator shows the volume of trades behind the pricing trends for tradable assets. The OBV formula achieves this by presenting a graph with the volume-weighted average price. Thus, with the OBV graphs, traders are able to understand the magnitude of the asset price momentum.
The OBV indicator is essential for traders who wish to thoroughly analyse a particular asset, as it visualises the volume of movements in the market. With the OBV indicator, it will be much easier to identify if the asset price is moving organically or if it is manipulated by the market speculators or dominant trading entities. Thus, employing the OBV indicator to understand the overall scope of asset price changes and avoid making hasty decisions is essential. While there are other options, the OBV formula is one of the most accurate volume indicators available.
#5 – Parabolic SAR (PSAR) Indicator
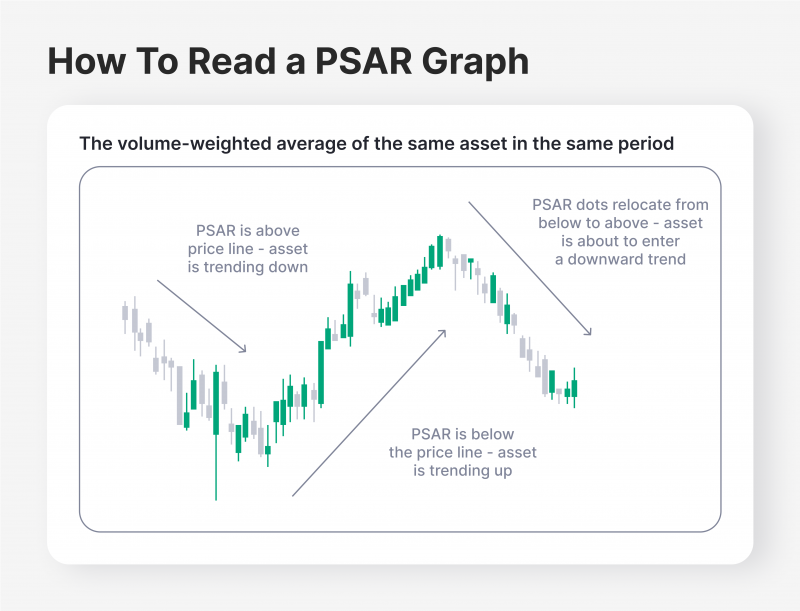 Finally, the PSAR indicator is another excellent measurement tool to identify tradable assets’ potential support and resistance levels. While the calculation of the PSAR indicator is highly complex and requires deep mathematical knowledge, it produces a simple and intuitive graph that indicates potential momentum swings for tradable assets.
The PSAR indicator creates a dotted line that follows the asset price trend throughout its price changes. If the dotted line is placed below the asset price trend, it showcases the potential upward momentum in the asset price. Conversely, if the PSAR lines are dotted above the asset price, it indicates a possible price drop is expected in the near future.
However, the biggest application of the PSAR indicator is in its reversal points. When the asset enters a trend reversal scenario, the PSAR dotted lines tend to change their placement in relation to the price movement. When the dotted lines go from the top to the bottom of the graph, this indicates the major shift in the asset price trend, giving traders the opportunity to reverse their investing positions accordingly. However, it is crucial to utilise the PSAR indicator in combination with other price analysis tools to double-check the potential price reversal.
Final Takeaways
Trend trading has become a go-to strategy for numerous investors worldwide, as it minimises the degree of uncertainty. With appropriate knowledge, expertise and practical experience, traders can utilise trend indicators to derive accurate pricing forecasts. Naturally, the trend indicators will not always predict the price momentum flawlessly, and the traders should account for the factor of unpredictability.
Despite their occasional inconsistencies and miscalculations, trend indicators have a proven track record of success. With enough diversification and careful strategies, traders will be able to reap significant profits from this strategy in both the short and long terms.