SOL Price Regains $100 Looking Past the Solana Outage Episode, What’s Next?
the last 36 hours, SOL/BTC surged by 4.5%, signaling a positive shift for Solana post-outage, reassuring traders of a potential rally ahead.
STORY HIGHLIGHTS
- Solana outperforms the broader crypto market, surging 4.5% extra over BTC.
- The Solana network activity takes a minor hit after the recent outage incident.
- If the SOL price break $110 resistance, it can rally further to $170.
As the broader cryptocurrency market registers a formidable recovery by surging 3.5% in the last 24 hours, Solana registers the most gains shooting past $100. At press time, the SOL price is up 6.58% currently trading at $101.73 with a market cap of $44.4 billion.
Solana Rebounds Strongly, Outperforms Bitcoin
According to on-chain data provided by Santiment, Solana (SOL) has emerged as one of the standout performers among altcoins this week, showcasing a notable surge in value compared to Bitcoin. The cryptocurrency has surged back above the $102 mark, indicating a resurgence in investor confidence.
ADVERTISEMENT
Over the past 36 hours, the SOL/BTC pair has experienced a significant increase of 4.5%, marking a positive turn of events for Solana. This surge comes in the aftermath of an outage that had concerned traders earlier in the week. Interestingly, what was initially perceived as a setback for Solana turned out to be a local bottom, with the fear, uncertainty, and doubt (FUD) surrounding the outage serving as a catalyst for the subsequent price rebound. Courtesy: Santiment
Earlier this week on Tuesday, February 6, the Solana blockchain network suffered a massive outage with 5-hours of downtime. Later, the blockchain network resumed production as developers released an upgrade to v1.17.20 and a restart of the cluster by validator operators.
The downtime occurred because of a malfunction in the BPF loader, also known as the “Berkley Packet Filter,” which is responsible for deploying, upgrading, and executing programs on the Solana network. To resolve the issue, developers have reworked the BPF code lines on the development network.
On-chain Indicators and SOL Price Prediction
Green Bitcoin Presale is Live Now!
Launching on Major Exchanges After the Presale
Stake $GBTC — The Future of Predict-To-Earn.
On January 31, the Solana blockchain logged its highest number of active users on the layer-1 network since its inception in 2020, reaching a total of 875,940 users. However, as per the data from Token Terminal, the network activity has been on a bit of a decline in the first week of February. Besides, the network activity seems to have taken a further hit amid the outage episode. Courtesy: Token Terminal
On the upside, the major resistance level for Solana stands at $110. If the SOL price manages to breach that, it could stage another 50% rally all the way to $170.
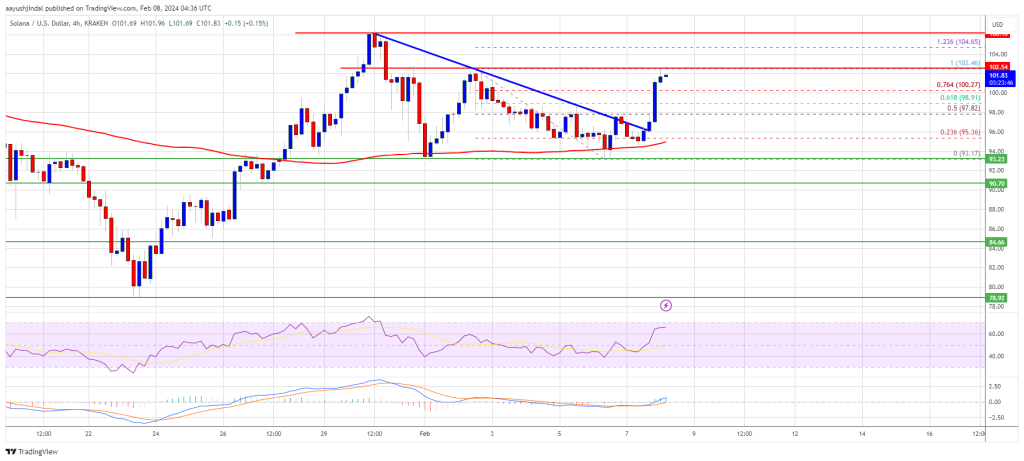
SOL Price Breaks $100 – Why Solana Could Pump Another 10%
Solana is gaining bullish momentum above $100. SOL price is signaling a fresh increase and might rally further toward the $112 level.
- SOL price started a fresh increase from the $93.20 support against the US Dollar.
- The price is now trading above $98 and the 100 simple moving average (4 hours).
- There was a break above a major bearish trend line with resistance at $96 on the 4-hour chart of the SOL/USD pair (data source from Kraken).
- The pair could continue to rally if it clears the $102.50 and $105.00 resistance levels.
Solana Price Regains Bullish Momentum
Solana price formed a base above the $93.20 support zone and recently started a fresh increase. There was a decent increase above the $96 and $98 levels.
The price is up over 7% and there was a move above the $100 level, outperforming Bitcoin and Ethereum. During the increase, the price cleared the 76.4% Fib retracement level of the downward move from the $102.46 swing high to the $93.17 low.
No KYC Casino and Sportsbook with up to 300% match bonus + 175 Free Spins, and Wager Free Cashback. Play now at ROLR.IO!
Besides, there was a break above a major bearish trend line with resistance at $96 on the 4-hour chart of the SOL/USD pair. Solana is now trading above $98 and the 100 simple moving average (4 hours). Source: SOLUSD on TradingView.com
570% up to 12 BTC + 300 Free Spins for new players & 1 BTC in bonuses every day, only at Wild.io. Play Now!
Immediate resistance is near the $102.50 level. The next major resistance is near the $105 level. A successful close above the $105 resistance could set the pace for another major increase. The next key resistance is near $112. Any more gains might send the price toward the $120 level.
Are Dips Supported in SOL?
If SOL fails to rally above the $105 resistance, it could start a downside correction. Initial support on the downside is near the $98 level.
The first major support is near the $96 level and the 100 simple moving average (4 hours), below which the price could test $93.20. If there is a close below the $93.20 support, the price could decline toward the $85 support in the near term.
Technical Indicators
4-Hours MACD – The MACD for SOL/USD is gaining pace in the bullish zone.
4-Hours RSI (Relative Strength Index) – The RSI for SOL/USD is above the 50 level.
Major Support Levels – $96, and $93.20.
Major Resistance Levels – $102.50, $105, and $112.
Disclaimer: The article is provided for educational purposes only. It does not represent the opinions of NewsBTC on whether to buy, sell or hold any investments and naturally investing carries risks. You are advised to conduct your own research before making any investment decisions. Use information provided on this website entirely at your own risk.
Bitcoin Price Surges Past Resistance, Is This The Start of Fresh Uptrend?
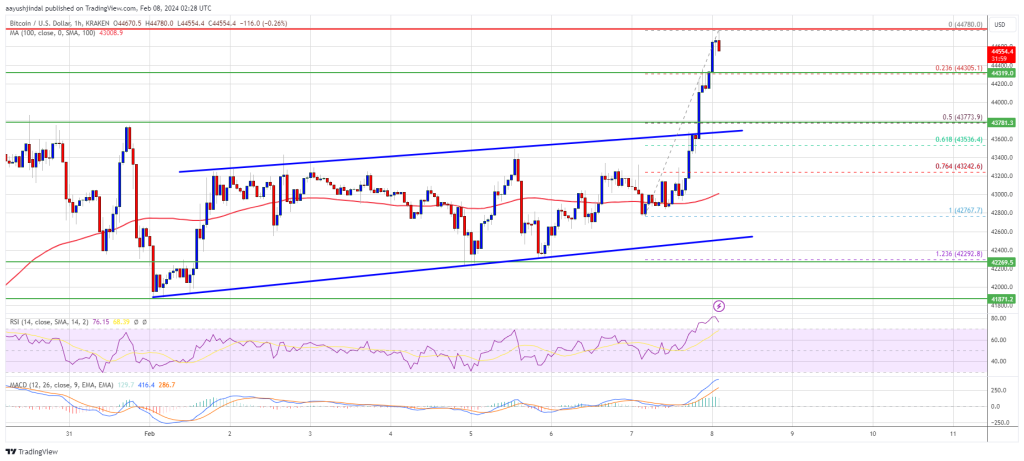
Bitcoin price is gaining pace above the $44,000 resistance. BTC could rise further if it clears the $44,800 resistance zone in the near term.
- Bitcoin price was able to surpass the $43,400 and $43,500 resistance levels.
- The price is trading above $44,000 and the 100 hourly Simple moving average.
- There was a break above a major rising channel with resistance at $43,650 on the hourly chart of the BTC/USD pair (data feed from Kraken).
- The pair could continue to move up if it clears the $44,800 resistance zone.
Bitcoin Price Starts Fresh Increase
Bitcoin price remained well-bid above the $42,500 level. BTC started a fresh increase above the $43,400 and $43,500 resistance levels. Besides, there was a break above a major rising channel with resistance at $43,650 on the hourly chart of the BTC/USD pair.
The pair even surged above the $44,000 resistance zone. It traded to a new weekly high at $44,780 and is currently consolidating gains. It is trading above the 23.6% Fib retracement level of the upward move from the $42,767 swing low to the $44,780 high.
No KYC Casino and Sportsbook with up to 300% match bonus + 175 Free Spins, and Wager Free Cashback. Play now at ROLR.IO!
Bitcoin is now trading above $44,000 and the 100 hourly Simple moving average. Immediate resistance is near the $44,800 level. The next key resistance could be $45,000, above which the price could start another decent increase. The next stop for the bulls may perhaps be $45,750. Source: BTCUSD on TradingView.com
570% up to 12 BTC + 300 Free Spins for new players & 1 BTC in bonuses every day, only at Wild.io. Play Now!
A clear move above the $45,750 resistance could send the price toward the $46,500 resistance. The next resistance could be near the $47,200 level. A close above the $47,200 level could push the price further higher. The next major resistance sits at $48,500.
Downside Correction In BTC?
If Bitcoin fails to rise above the $44,800 resistance zone, it could start a downside correction. Immediate support on the downside is near the $44,300 level.
The first major support is $43,750 and the 50% Fib retracement level of the upward move from the $42,767 swing low to the $44,780 high. If there is a close below $43,750, the price could gain bearish momentum. In the stated case, the price could dive toward the $43,000 support.
Technical indicators:
Hourly MACD – The MACD is now gaining pace in the bullish zone.
Hourly RSI (Relative Strength Index) – The RSI for BTC/USD is now above the 50 level.
Major Support Levels – $44,300, followed by $43,750.
Major Resistance Levels – $44,800, $45,750, and $45,500.
Disclaimer: The article is provided for educational purposes only. It does not represent the opinions of NewsBTC on whether to buy, sell or hold any investments and naturally investing carries risks. You are advised to conduct your own research before making any investment decisions. Use information provided on this website entirely at your own risk.
Tags: bitcoinbitcoin pricebtcusd


![[LIVE] Engage2Earn: Save our PBS from Trump](https://cdn.bulbapp.io/frontend/images/c23a1a05-c831-4c66-a1d1-96b700ef0450/1)


![[ℕ𝕖𝕧𝕖𝕣] 𝕊𝕖𝕝𝕝 𝕐𝕠𝕦𝕣 𝔹𝕚𝕥𝕔𝕠𝕚𝕟 - And Now What.... Pray To The God Of Hopium?](https://cdn.bulbapp.io/frontend/images/79e7827b-c644-4853-b048-a9601a8a8da7/1)


