98% probability of Bitcoin falling to the GAP zone

On the Weekly time frame, BTC price is still around the CME Gap at the 39,300 area, this is the difference between the closing price of the 6th session and the opening price of the 2nd session in early December 2023.
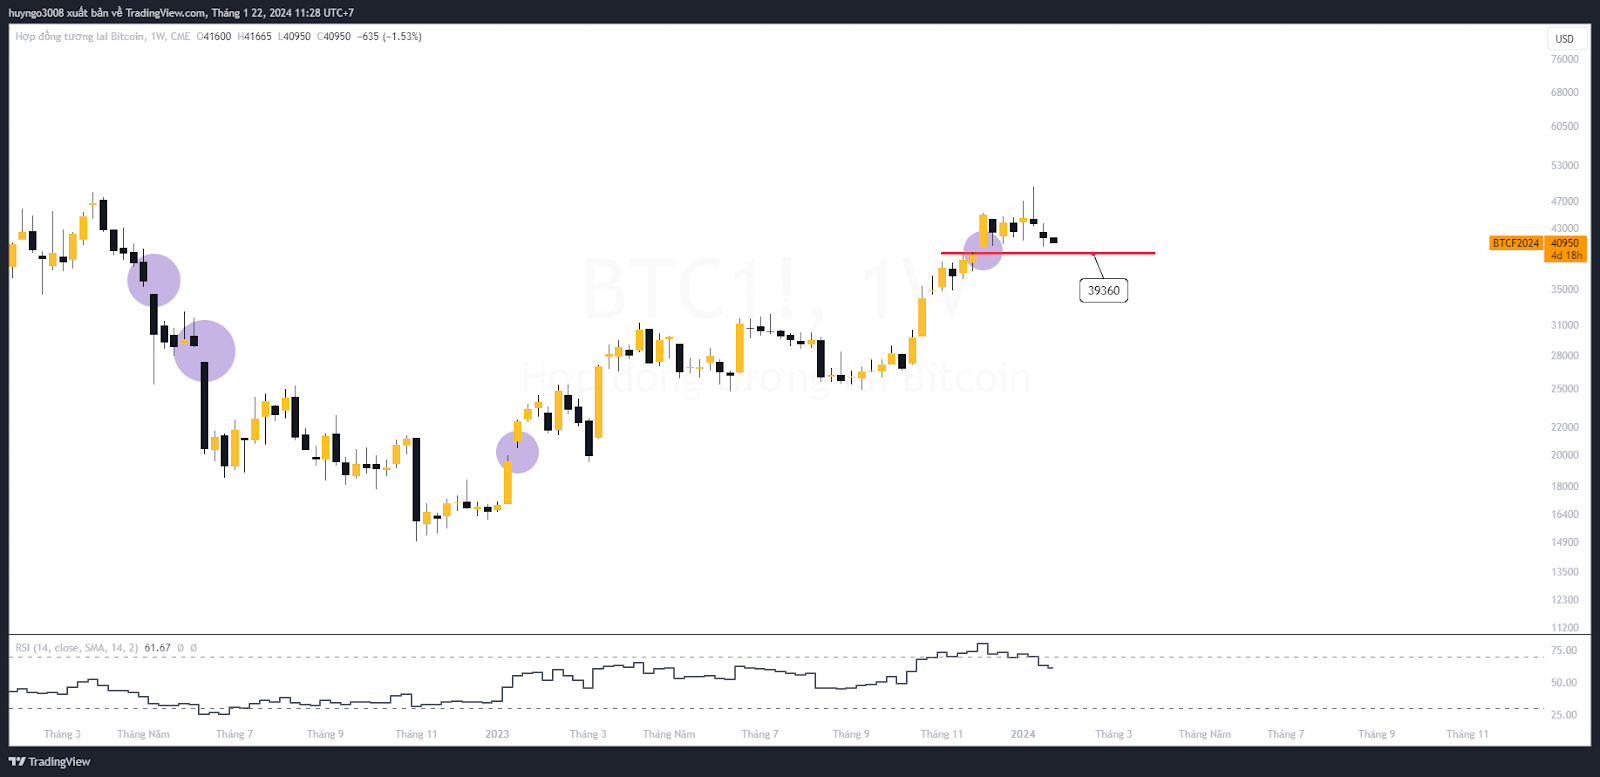 Bitcoin Gap CME.
Currently, the test results in historical data show that up to 98% of BTC prices will tend to fill these gaps, however this is not an absolute signal, it is only relative and used for reference.
In the Weekly frame, BTC price is still being heavily attacked by the Sellers in the 40,000 - 48,000 USD area. There have been strong sell signals through the bearish Pinbar candlestick, but there have not been many more bearish signals appearing in the Weekly frame. . The main trend is still tilted towards price increases.
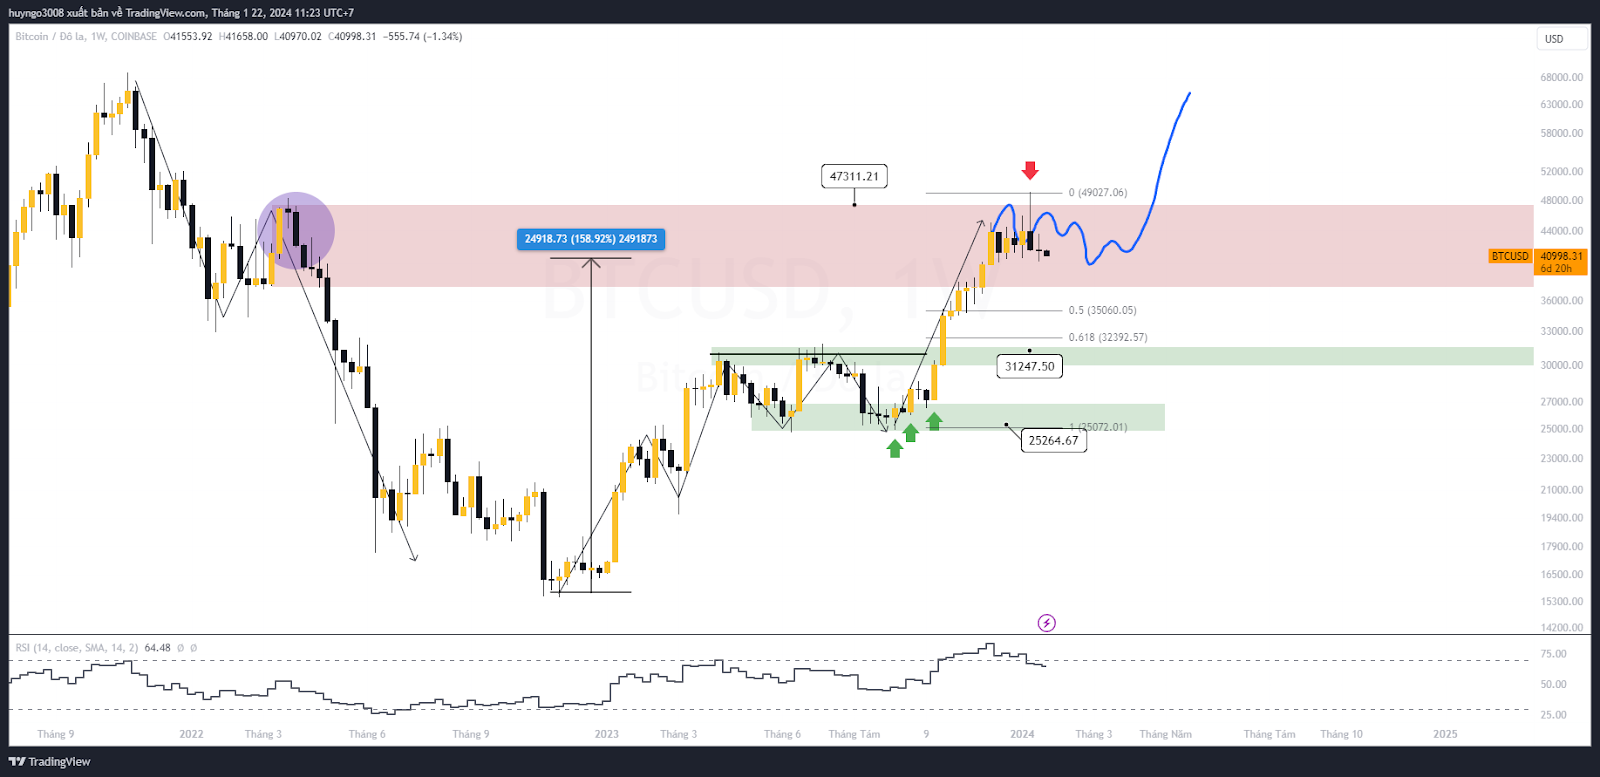 BTC price weekly frame.
On the Daily frame, BTC price has decreased 17% from the most recent peak of 49,000 USD. Currently, the price has also appeared and activated the RSI peak divergence signal. Previously, this RSI peak divergence signal appeared, but with the news that the Bitcoin ETF was approved, the price still pushed up 1 beat at 49,000 USD. .
After the news of the Bitcoin ETF was released, BTC was sold quite strongly, which also triggered the RSI peak divergence setup.
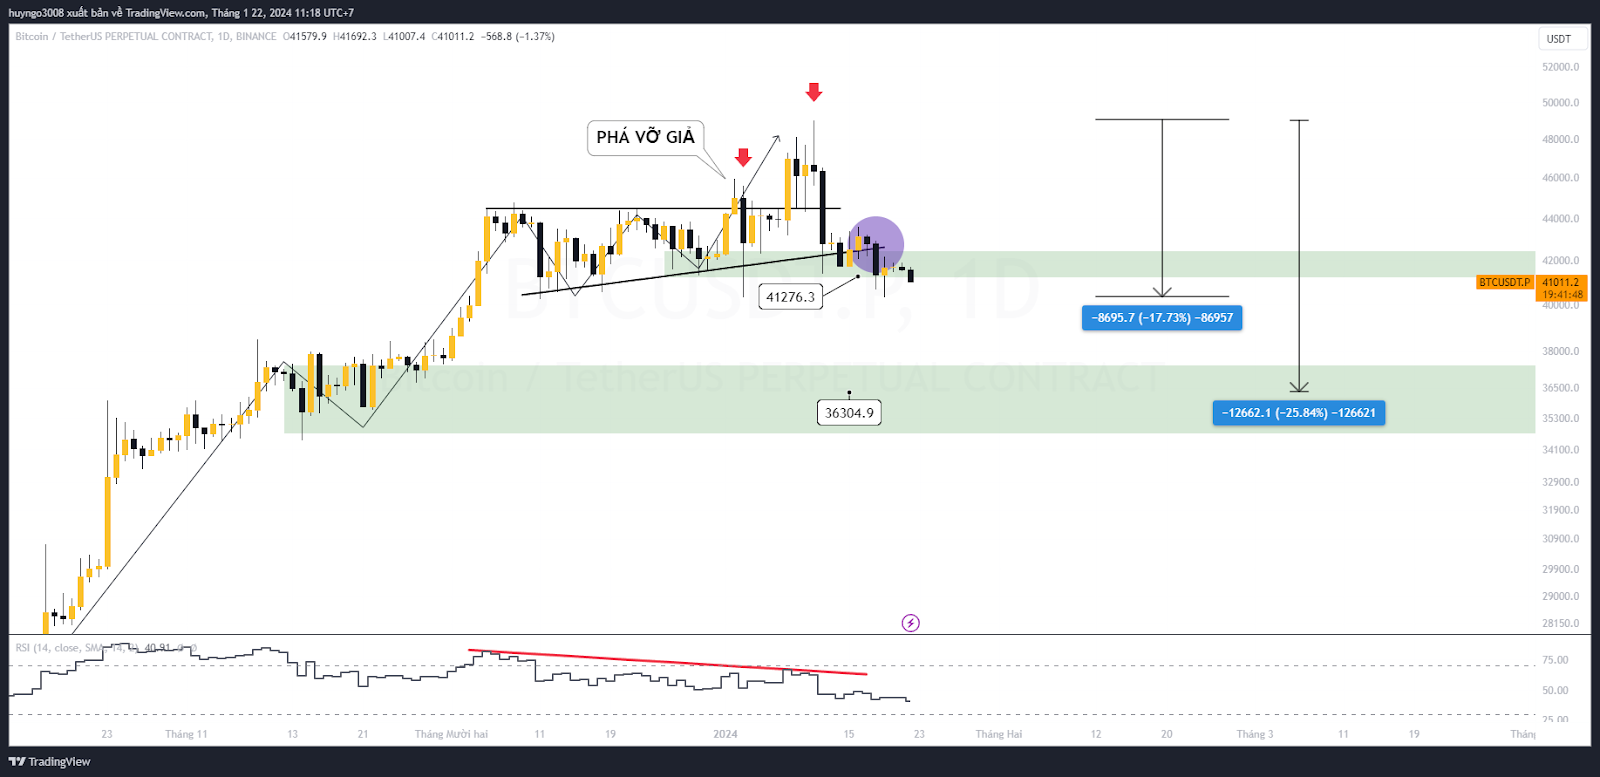 BTC price daily frame.
The uptrend of BTC frame D1 is being threatened by the price breaking the upward trendline. It is possible that if the $40,000 zone is breached, the price will find the next support zone at $35,000 - $36,000. That is also a 25% correction of BTC from the price of 49,000 USD.
In the Daily frame, the total Crypto market capitalization chart is being supported by the 1,500 - 1,650B USD zone and the 50-day EMA. Total1's trend is still inclined to increase prices, however, if the 1,500B USD zone (blue) is breached, it is quite dangerous because the Uptrend has been broken.
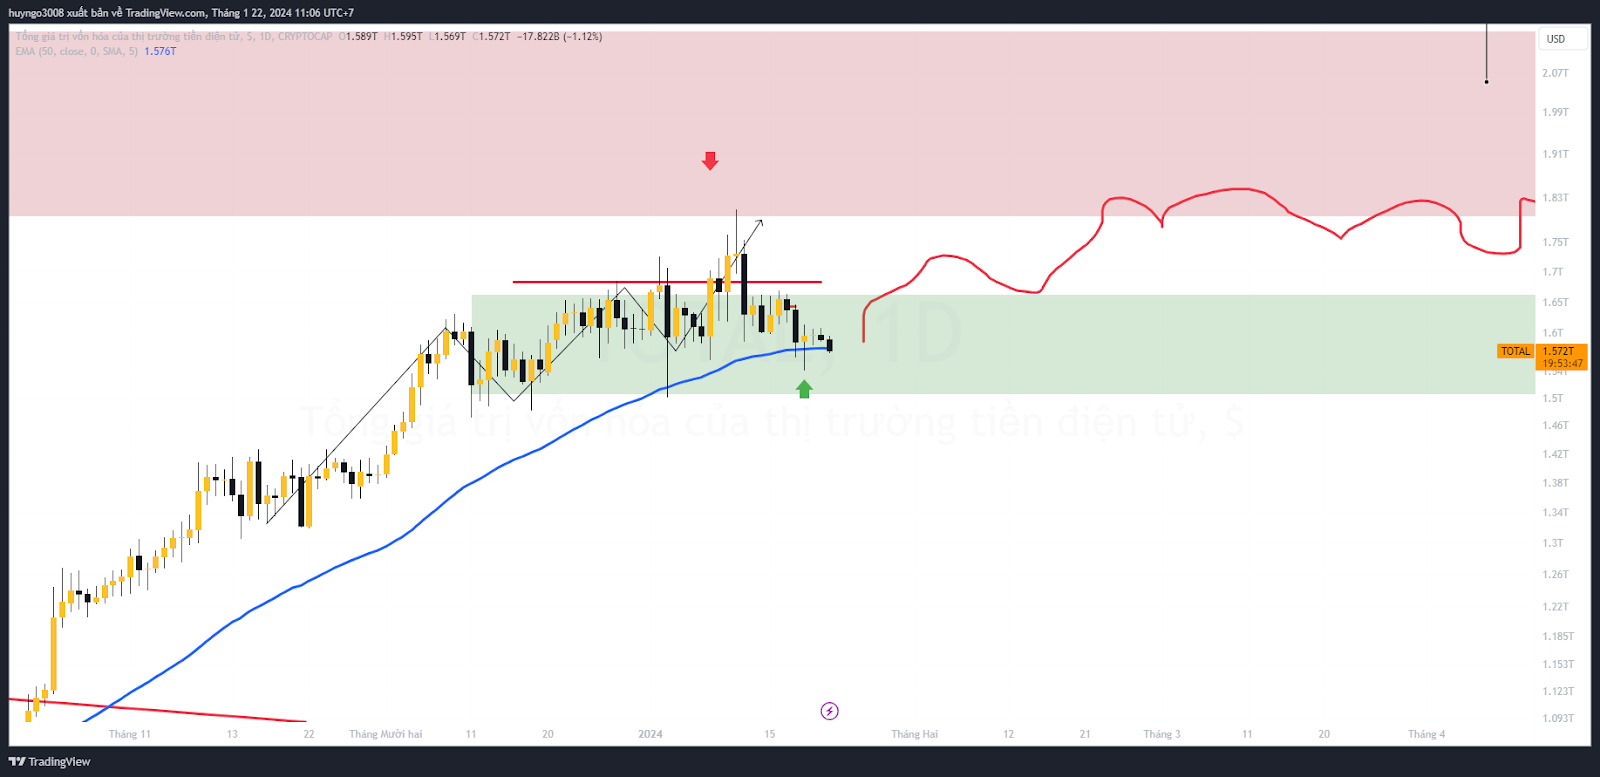 Total market capitalization.
On the contrary, if a bullish setup appears in the current area, it is also a good signal signaling the participation of the Buyers and will likely push the price of BTC and Altcoin up again. That is also the setup to buy Altcoins for Spot and Hold positions until 2025 in anticipation of the Bull run season.
Because there is currently no bullish setup, the strong support zone has not broken yet, so this stage is quite dangerous, you should just stand aside and observe.
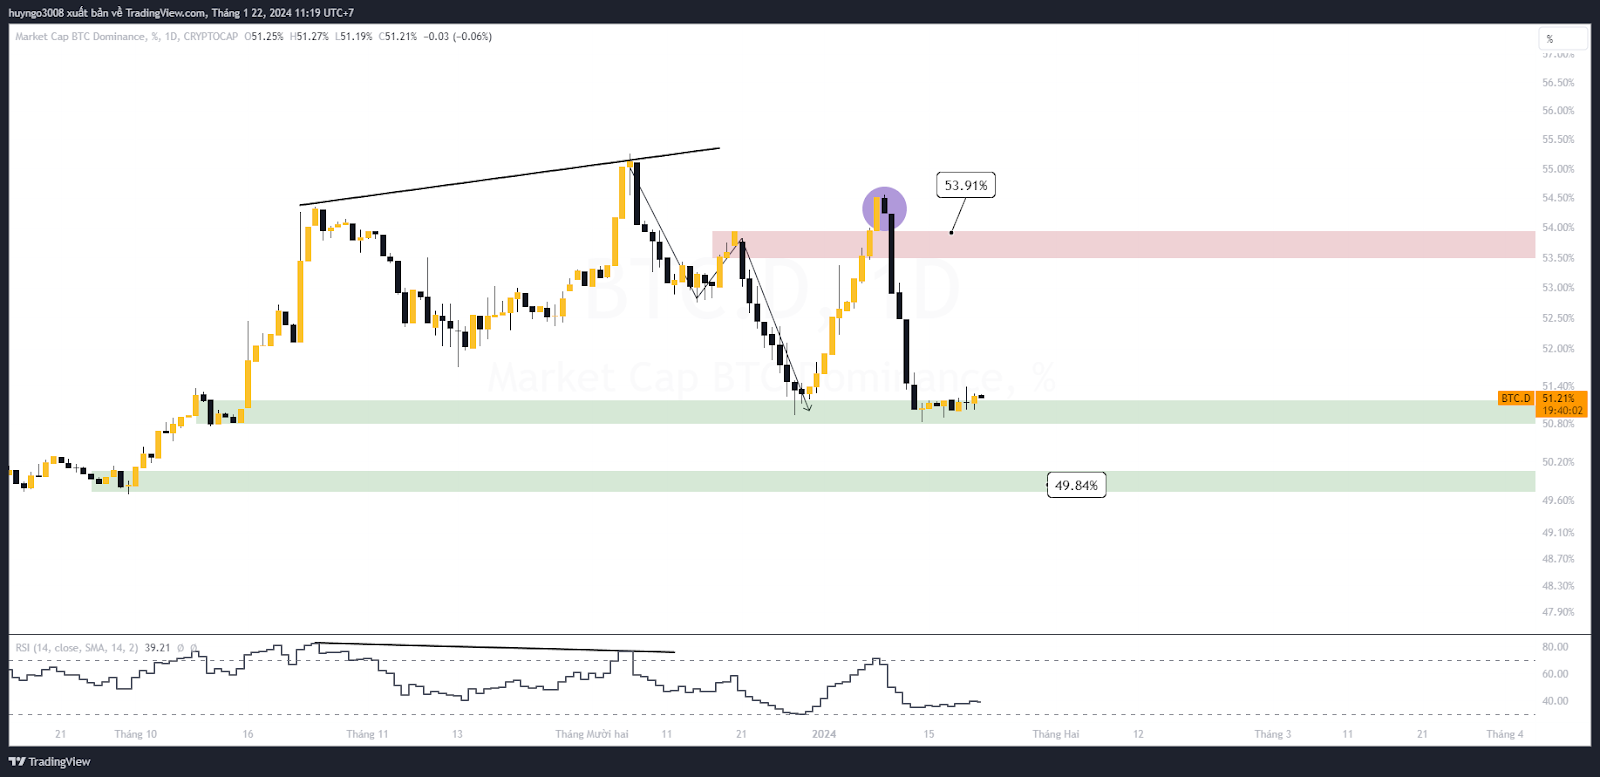 BTC capitalization.
In the Bitcoin market share chart, it is in the support area of the Daily frame, with the D1 trend leaning towards the downside, so it can be expected that Bitcoin will cede more market share to Altcoins to benefit in the near future. Dom BTC breached the 50.8% area and will continue to fall to the 49.6% area in the near future.
In short, this period is an adjustment wave for the market in general, the current price range is much better than when BTC was at 49,000 USD. You can watch when BTC fills the CME Gap at 39,300 USD and there is a bullish setup in the Daily frame, then buy BTC or Altcoins.
At the current stage, short-term trade positions should stand aside and observe, when there is a clear trend and confluence of large frames, then enter the order.
Read more: To what level can Bitcoin price correct?


![[ℕ𝕖𝕧𝕖𝕣] 𝕊𝕖𝕝𝕝 𝕐𝕠𝕦𝕣 𝔹𝕚𝕥𝕔𝕠𝕚𝕟 - OM(G) , My Biggest Bag Was A Scam????](https://cdn.bulbapp.io/frontend/images/99de9393-38a8-4e51-a7ab-a2b2c28785bd/1)


