What is Price Action? – Price Action Trading Explained
What Is Price Action? – Price Action Trading Introduction
What is Price Action? – Price Action Trading Explained
Price action trading is a methodology for financial market speculation which consists of the analysis of basic price movement across time. It’s used by many retail traders and often by institutional traders and hedge fund managers to make predictions on the future direction of the price of a security or financial market.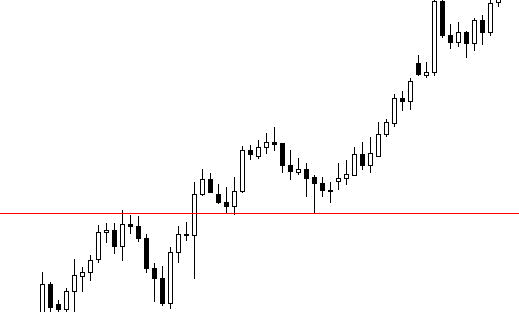 Put simply, price action is how price changes, i.e., the ‘action’ of price. It’s most easily observed in markets with high liquidity and volatility, but really anything that is bought or sold in a free market will generate price action.
Price action trading ignores the fundamental factors that influence a market’s movement, and instead it looks primarily at the market’s price history, that is to say its price movement across a period of time. Thus, price action is a form a technical analysis, but what differentiates it from most forms of technical analysis is that its main focus is on the relationship of a market’s current price to its past or recent prices, as opposed to ‘second-hand’ values that are derived from that price history.
In other words, price action trading is a ‘pure’ form of technical analysis since it includes no second-hand, price-derived indicators. Price action traders are solely concerned with the first-hand data a market generates about itself; it’s price movement over time.
- Price action analysis allows a trader to make sense of a market’s price movement and provides him or her with explanations that serve as way for the trader to build a mental scenario to describe the current market structure. Experienced price action traders often attribute their unique mental understanding and ‘gut feel’ of a market as the main reason for their profitable trading.
Price action traders make use of the past history of a market’s price movement, most typically focus on the recent price action of the last 3 to 6 months, with a lighter focus on more distant price history. This price history includes swing highs and swing lows in a market, as well as support and resistance levels.
A trader can use a market’s price action to try and describe the human thought process behind a market’s movement. Every participant in a market will leave price action ‘clues’ on a market’s price chart as they trade their markets, these clues can then be interpreted and used to try and predict the next move in a market.
Price Action Trading – Keeping it Simple
Price action traders often use the phrase “Keep It Simple Stupid” in reference to the fact that trading is something many people over-complicate by clouding their charts with numerous technical indicators and generally over-analyzing a market.
- Price action trading is also sometimes referred to as ‘clean chart trading’, ‘naked trading’, ‘raw or natural trading’, in reference to trading from a simple price action only price chart.
The simple stripped-down approach of price action trading, means there are no indicators on a trader’s charts and no economic events or news is used in making one’s trading decisions. The sole focus is on a market’s price action, and the belief amongst price action traders is that this price action reflects all the variables (news events, eco. data etc.) that influence a market and cause it to move. Therefore, the implication is that it’s much simpler to just analyze a market and trade from its price action, rather than trying to decipher and sort the many different variables affecting a market each day.
Price Action Trading Strategies (Patterns)
Price action patterns, also called price action ‘triggers’, ‘setups’ or ‘signals’, are really the most important aspect of price action trading, because it’s these patterns that provide a trader with strong clues as to what price might do next.
The following diagrams show examples of some simple price action trading strategies that you can use to trade the market.
- Inside bar pattern
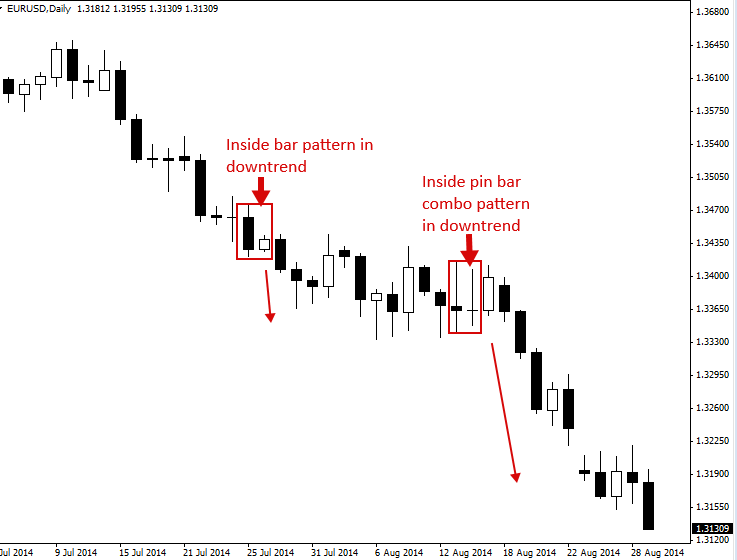
An inside bar pattern is a two-bar pattern, consisting of the inside bar and the prior bar which is usually referred to as the “mother bar”. The inside bar is contained completely within the high to low range of the mother bar. This price action strategy is commonly used as a breakout pattern in trending markets, but it can also be traded as a reversal signal if it forms at a key chart level.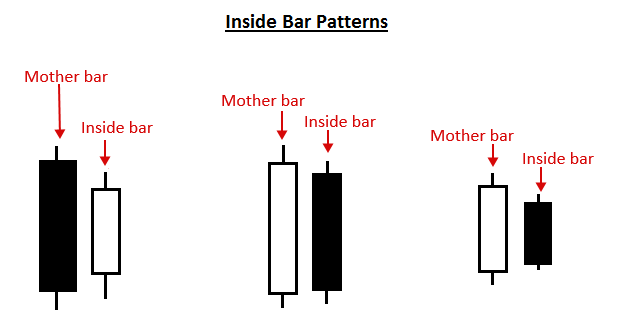
- Pin bar pattern
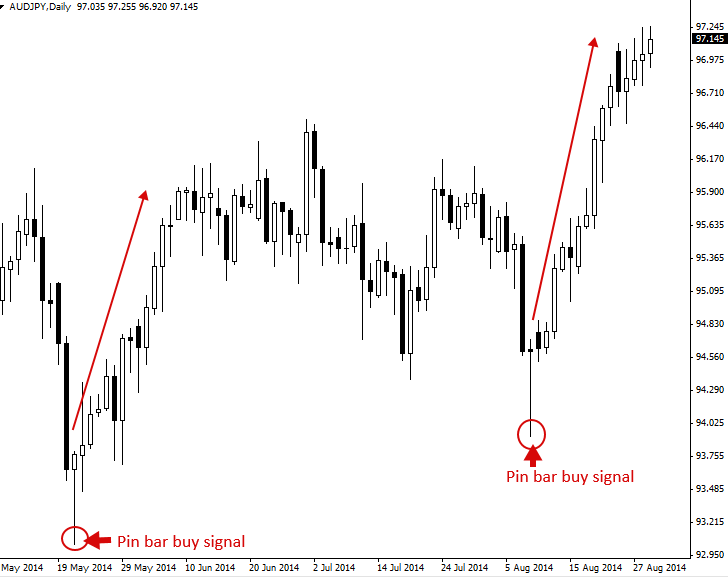
A pin bar pattern consists of a single candlestick and it shows rejection of price and a reversal in the market. The pin bar signal works great in a trending market, range bound market and can also be traded counter-trend from a key support or resistance level. The pin bar implies that price might move opposite from the direction the tail is pointing; as it’s the tail of the pin bar that shows rejection of price and a reversal.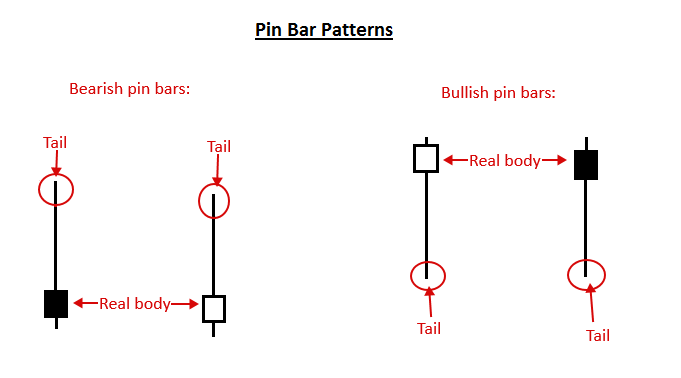
- Fakey pattern
The fakey pattern consists of a false breakout of an inside bar pattern. In other words, if an inside bar pattern breaks out briefly but then reverses and closes back within the range of the mother bar or inside bar, you have a fakey. It’s called a “fakey” because it fakes you out, the market looks like its breaking one way but then comes back in the opposite direction and sets off a price movement in that direction. Fakey’s are great with trends, against trends from key levels and in trading ranges.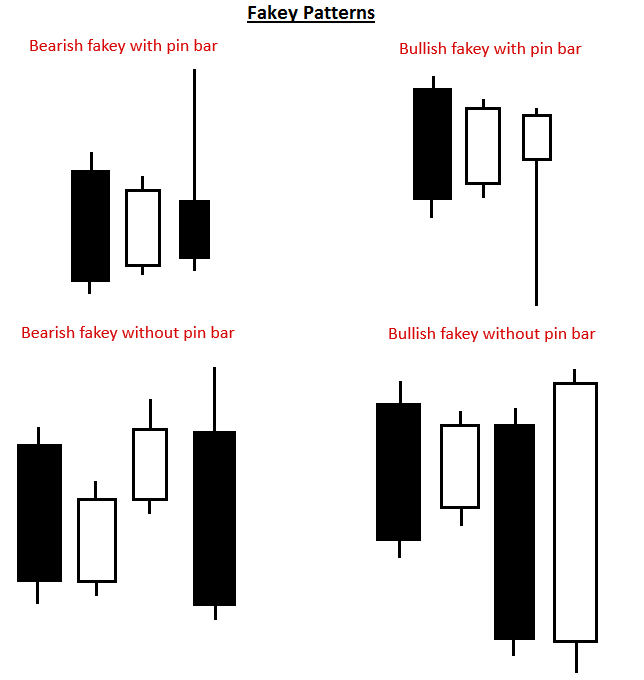 Trading with Price Action Patterns
Let’s look at some real-world examples of trading with price action patterns.
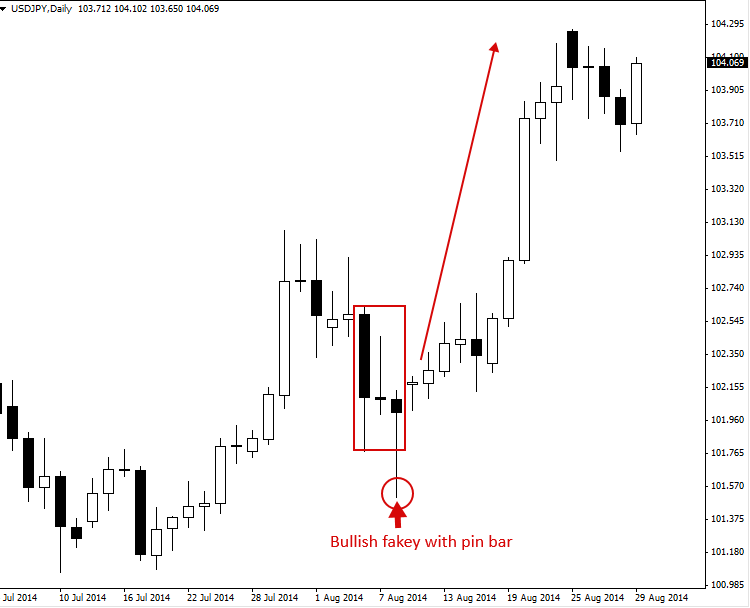
The first chart we are looking at shows us a bearish fakey sell signal pattern. In this example, the trend was already down, as we can see the overall downward track starting at the top left of the chart and falling as price moves toward the left side of the chart. Thus, this fakey sell signal was in-line with the overall daily chart downtrend, this is good. Trading with the trend generally gives a price action setup a better chance of working in your favor.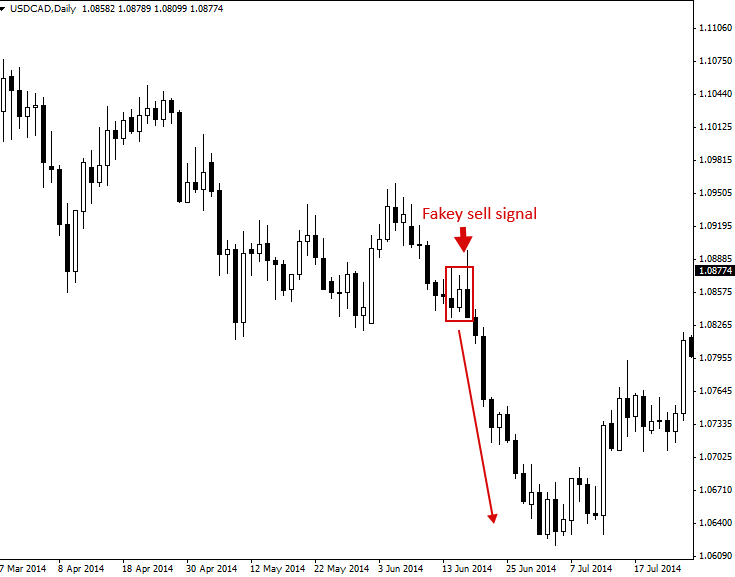 The chart below shows an example of a bullish fakey pin bar combo setup in the context of an upward moving market. Typically, when a market has a strong near-term bias, meaning it’s been moving in one direction recently and aggressively, a price action trader wants to trade in-line with that near-term momentum.
 In this next example, we are looking at the inside bar trading pattern. This chart shows both a regular inside bar signal as well as an inside pin bar combo setup. An inside pin bar combo is simply an inside bar with a pin bar for the inside bar. These setups work very well in trending markets like we see in the chart below.
 The last chart we are looking shows examples of the pin bar pattern. Note the large up moves that followed both of these pin bar buy signals. Also, note how these pin bars both had long tails in comparison to some of the other bars on this chart that you might identify as pin bars. Pin bars wit nice long tails like these two, and that are clearly protruding out from the surrounding price action, often are very good setups to trade.
 Trading Price Action Patterns with Confluence
Trading with price action signals is not only about the signal itself, but it’s also about where the signal forms on the chart. Every pin bar, inside bar, etc. is not created equal. Depending on where a particular price action signal forms in a market, you may not want to trade it or you may want to jump on it without hesitation.
The best price action signals are those that form at ‘confluent’ points in the market. Confluence, simply means ‘a coming together’ of people or things. In the case of price action trading we are looking for an area on the chart where at least a couple things line up with a price action entry signal. When this happens, we say the price action signal ‘has confluence’.
In the chart example below, we can see a good example of a pin bar pattern with confluence. The confluence is that the pin bar has formed in the direction of an up-trending market and that it has formed at a support level in that uptrend. Thus, we have the confluence of the trend and the support level, together these things give the pin bar buy signal more weight than if they weren’t there supporting the signal. The more confluent factors a price action signal has behind it, the higher-probability signal it is considered to be.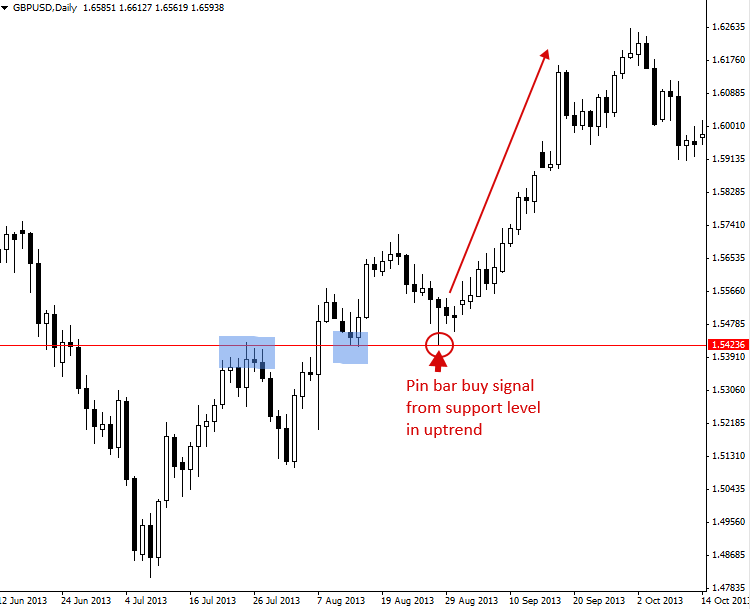 Conclusion
I hope you’ve enjoyed this price action trading tutorial. You now have a solid basic understanding of what price action is and how to trade it.
Going forward, you should look to expand your price action trading understanding and knowledge as there is much more to it than is covered here.
For a complete education and in-depth insight into simple yet powerful price action strategies, as well as insight into the world of professional trading from an experienced trading veteran, checkout my price action trading course for more information


