What is Flag Formation?

The flag formation is a chart pattern frequently used in technical analysis. It is generally considered a strong sign that a trend will continue. The flag formation occurs after an upward or downward trend interruption and gives a signal that the trend will continue.
The flag formation is a chart pattern frequently used in technical analysis. This formation refers to a structure that occurs after the price makes a sharp movement in a certain direction, and then this movement continues in an almost horizontal plane.
The flag formation is often interpreted as a continuation of a trend. In an uptrend, prices rise sharply, followed by a flag formation; This is when prices fluctuate within a certain range or experience a slight decline for a period of time. Then, as the trend continues, prices rise again. In a downtrend, it occurs in a similar manner, but prices form a flag after a downward move and then the downtrend continues.
Flag formations give investors an idea that the trend will continue. Generally, after the formation of the formation, prices are expected to tend to move in the direction of the trend. Traders often use this pattern to determine entry and exit points.How to Interpret Flag Formation?
Identifying the Trend: First, the flag formation occurs within a trend. Generally, this trend can be upward or downward. First, it is important to determine in which direction there is a trend.
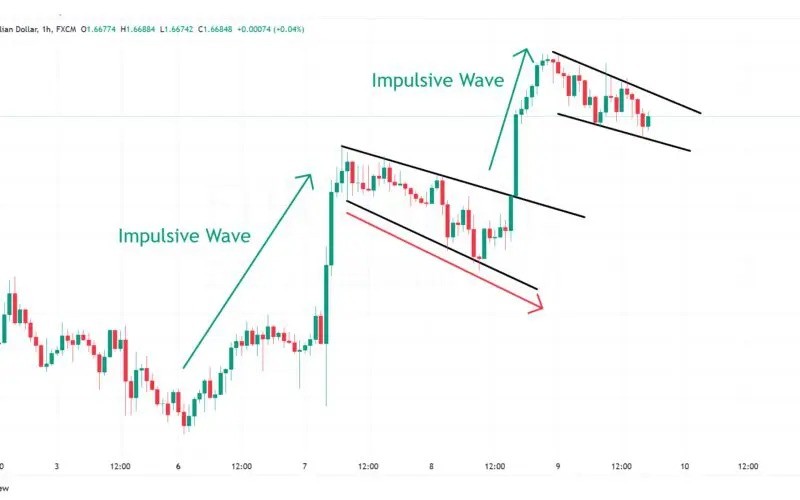
Flagpole and Flag Body: Flag formation consists of two components called a flagpole and a flag body. The flagpole is a sharp and steep movement of the previous trend. The body of the flag is then the part where prices move in an almost horizontal plane and fluctuate within a certain range.
Completion of the Formation: The flag formation is completed with the formation of the flag body. Usually this happens when prices fluctuate in a range or trend slightly downward over a period of time.
Volume Analysis: Volume is also an important factor when interpreting the flag formation. Volume along the flagpole generally increases, but volume along the body of the flag generally decreases or remains constant. This indicates that investors showed intense interest in the initial phase when prices moved rapidly, but then trading volume decreased during the formation of the flag.
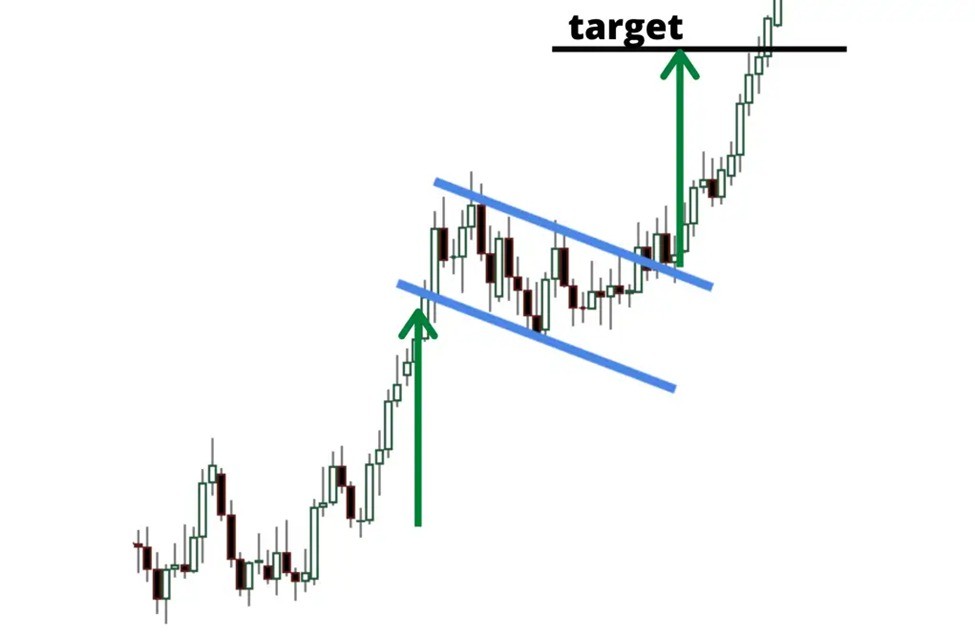
Breakout Point: The breakout point of the flag formation is the point where the price breaks the upper or lower limit of the flag body, indicating that the previous trend will continue. In an uptrend, the price is expected to break the upper limit of the flag body in an upward direction, while in a downtrend, the price is expected to break the lower limit of the flag body in a downward direction.
Target Calculation: The price target after the breakout point of the flag formation can be determined by the size of the flagpole. In an uptrend, the target price can be determined by measuring the length of the flagpole upward from the breakout point. In a downward trend, this happens in the opposite direction.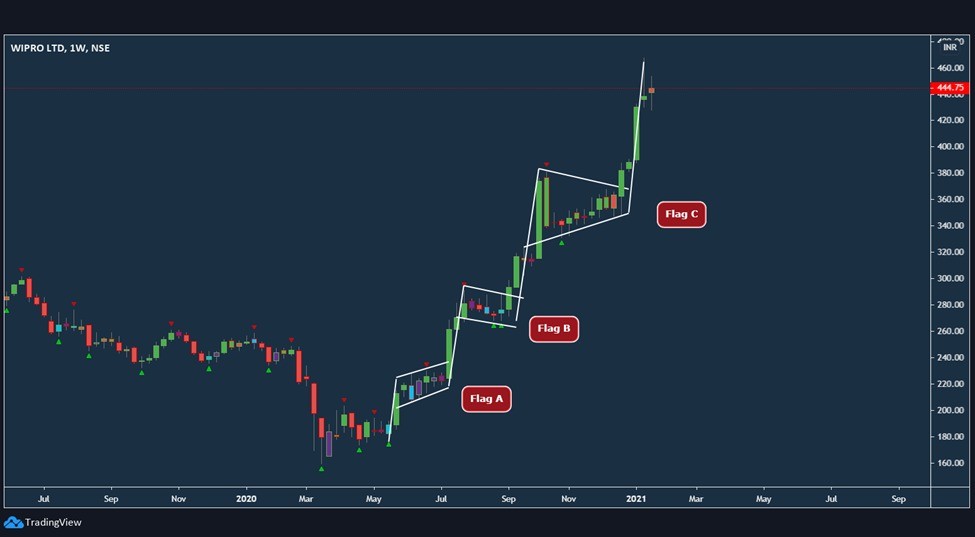
hat Happens After the Flag Formation?
After the flag formation is completed, prices usually make a break in the direction where the previous trend will continue. This is a basic principle where traders view the flag formation as a trend continuation pattern and use it to gauge the momentum of the trend.
Upward Flag Formation: In a flag formation formed in an uptrend, prices usually break the upper limit of the flagpole and initiate an upward move. This indicates that the previous upward trend will continue and prices will rise further.
Downward Flag Formation: In a flag formation formed in a downward trend, prices generally break the lower limit of the flag body and initiate a downward movement. This indicates that the previous downward trend will continue and prices will fall further.
However, as always, there are no certainties in the markets. After the flag formation is completed, prices may not move in the expected direction or may give wrong signals when the formation is broken. Therefore, investors should use risk management strategies and avoid making decisions based on a single technical indicator.
Advantages of Flag Formation
Identifying Trend Continuation: Flag formation usually signals the continuation of a trend. It occurs after the previous trend and indicates that the trend has taken a short break. Therefore, the trend is likely to continue.
Establishing a Clear Target Price: The size of a flag formation can often be about the height of the flagpole. This can help set a target price at the point where the formation completes.
Relative Ease: The flag pattern is easier to recognize and interpret than other complex technical analysis patterns. Therefore, it is often used by beginners and experienced traders.
Disadvantages of Flag Formation
False Signal Risk: As with every technical analysis model, the flag formation can be misleading. When you receive a signal that the formation is complete, it is important to consider the risk that prices may not move in the expected direction.
Corrective Movements: After the completion of the flag formation, prices may move quickly towards the target, but sometimes you may see corrective movements for a while after the formation is completed. This shows that investors need to be patient and manage their positions well.
Low Confidence: Some traders point to the low reliability level of the flag formation. This means that the pattern may not always be predicted accurately and may fail.
![[LIVE] Engage2Earn: auspol follower rush](https://cdn.bulbapp.io/frontend/images/c1a761de-5ce9-4e9b-b5b3-dc009e60bfa8/1)


