Solana Price Prediction: SOL could easily go all the way back to $79.49 low
- Solana price remains below the midline of the market range with the bears showing strength
- SOL could drop 20%, revisiting the January 23 lows before the next leg up .
- The bearish thesis will be invalidated if the price breaks and closes above the 50% Fibonacci level of $102.88.
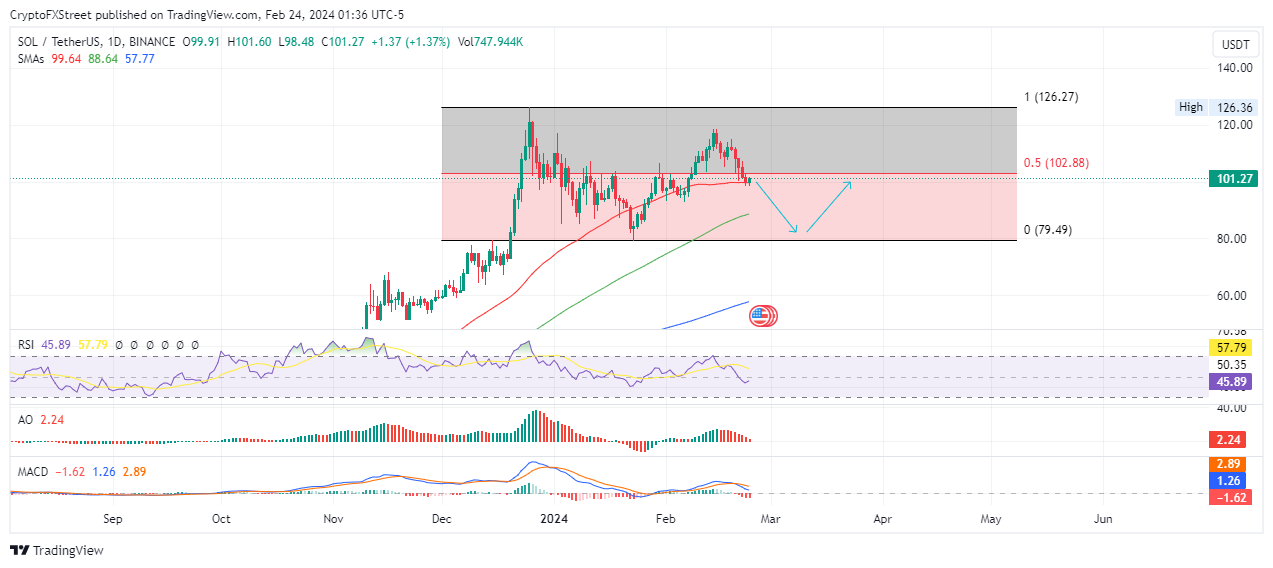
Solana (SOL) price is trading with a bearish bias, recording a series of lower highs and lower lows since mid-February. The downtrend has seen the Layer 1 (L1) token drop below the midline of the market range between $79.49 and $126.27.
Also Read: Filecoin Price Prediction: After Solana integration, $10.00 is in sight for FIL once this barrier breaks
Solana price could drop all the way to the low
Solana (SOL) price is sitting on support due to the 50-day Simple Moving Average (SMA) at $99.64. If this support level gives in, SOL could drop to the 100-day SMA at $88.64, or worse, extend a leg down to the bottom of the market range at $79.49.
The Relative Strength Index (RSI) is below the 50% midline, pointing to a low price strength. The Moving Average Convergence Divergence (MACD) is also below its signal line, suggesting a bearish cycle. Also, its histogram bars are below the 50 midline, flashing red to show the bears dominance in the SOL market.
The bearish thesis is also accentuated by the Awesome Oscillator (AO), whose histogram bars are flashing red and edging towards negative territory. SOL/USDT 1-day chart
Conversely, if the bulls increase their buying pressure, Solana price could push north, flipping $102.88 support into resistance and using it as the jumping off point for extended gains.
Enhanced bier momentum above this level could see SOL market value reclaim the mid-February highs around the $120.00 psychological level, or in a highly bullish case, extend to the peak of the market range at $126.27. Such a move would constitute a 25% climb above current levels.
Share:
Share on Twitter
Share on Facebook
Copy to clipboard
Cryptos feed
Information on these pages contains forward-looking statements that involve risks and uncertainties. Markets and instruments profiled on this page are for informational purposes only and should not in any way come across as a recommendation to buy or sell in these assets. You should do your own thorough research before making any investment decisions. FXStreet does not in any way guarantee that this information is free from mistakes, errors, or material misstatements. It also does not guarantee that this information is of a timely nature. Investing in Open Markets involves a great deal of risk, including the loss of all or a portion of your investment, as well as emotional distress. All risks, losses and costs associated with investing, including total loss of principal, are your responsibility. The views and opinions expressed in this article are those of the authors and do not necessarily reflect the official policy or position of FXStreet nor its advertisers. The author will not be held responsible for information that is found at the end of links posted on this page.
If not otherwise explicitly mentioned in the body of the article, at the time of writing, the author has no position in any stock mentioned in this article and no business relationship with any company mentioned. The author has not received compensation for writing this article, other than from FXStreet.
FXStreet and the author do not provide personalized recommendations. The author makes no representations as to the accuracy, completeness, or suitability of this information. FXStreet and the author will not be liable for any errors, omissions or any losses, injuries or damages arising from this information and its display or use. Errors and omissions excepted.
The author and FXStreet are not registered investment advisors and nothing in this article is intended to be investment advice.
Join Telegram
Bitcoin price eyes $48,000 as revealed emails bring back the 'who is Satoshi' debate
- Bitcoin price continues to hold the $51,335 support, but the depressed outlook continues to become heavier.
- BTC could make a 10% fall before the next leg up as multiple technical indicators flash bearish signs.
- A higher high above $52,985 would invalidate the bearish thesis, opening the possibility for more gains.
Bitcoin (BTC) continues to take to a directional bias, with the market now busy truing to read through the 120 pages of BTC creator Satoshi Nakamoto, for clues about his identity.
Re Satoshi’s identify this has to be the best clue given there’s maybe 18 humans total who like both pineapple and jalapeños on their pizza. https://t.co/XpG1pRozVF
— Eric Balchunas (@EricBalchunas) February 23, 2024
Among the highlights is, "My choice for the number of coins and distribution schedule was an educated guess," together with the humorous, "100 push-ups a day will send the price to 100k,"
Also Read: Bitcoin price could drop 7%, but MicroStrategy nearly merits S&P 500 inclusion
Bitcoin creator emails revealed
In a post on X, one of the earliest collaborators of BTC creator Satoshi Nakamoto has shared emails of their discussion. The revelations have contradicted popular opinion that Satoshi Nakamoto's earliest collaborator was likely Hal Finney, a well-known cryptographer.
1/25
I've always thought that Hal Finney was the main person behind Satoshi Nakamoto (Supported by 1 or 2 other minor characters)
And I think the new emails help back that up overwhelmingly: pic.twitter.com/hWD3wcos8d
— Adam Cochran (adamscochran.eth) (@adamscochran) February 23, 2024
Elsewhere in a Thursday blog titled “ETF approval for Bitcoin – the naked emperor’s new clothes”, the European Central Bank (ECB) detailed an analysis of the Bitcoin market, saying that the king of cryptocurrency “has failed on the promise to be a global decentralized digital currency,” adding that BTC “is still hardly used for legitimate transfers.”
The blog also argues that despite the landmark approval of spot BTC exchange-traded funds (ETFs) on January 10, BTC is still not suitable as a means of payment or as an investment. The ECB contravenes the general opinion among crypto proponents that ETF approvals validate BTC as a safe investment.
The Central Bank also said that the preceding rally seen in Bitcoin price following the approvals is proof of an unstoppable triumph is false, highlighting that the fair value of Bitcoin remains zero.
We disagree with both claims and reiterate that the fair value of Bitcoin is still zero…the use of ETFs as financing vehicles does not change the fair value of the underlying assets.
The ECB says that there is a worst-case scenario where Bitcoin’s expected boom fails, urging traders to brace for massive collateral damage, including the “ultimate redistribution of wealth at the expense of the less sophisticated.”
Debunking the “false promises of Bitcoin” and warning of the social dangers if not effectively addressed, the blog argued:
- Bitcoin has not lived up to its original promise to become a global decentralized digital currency.
- Bitcoin’s promise to be a financial asset whose value would inevitably continue to rise is equally wrong.
- Bitcoin transactions are still inconvenient, slow, and costly.
- Bitcoin is still not suitable as an investment.
- Bitcoin mining using the proof of work (PoW) mechanism pollutes the environment on the same scale as entire countries.
- Increased Bitcoin prices imply higher energy consumption because then miners are able to cover higher costs.
Further, the ECB report acknowledges that while Bitcoin price is gaining as hope grows the Fed could lower interest rates and increase the risk appetite of investors. Then again, the report says, “This could turn out to be a flash in the pan.”
Bitcoin price outlook as the ECB wrecks and demolishes BTC
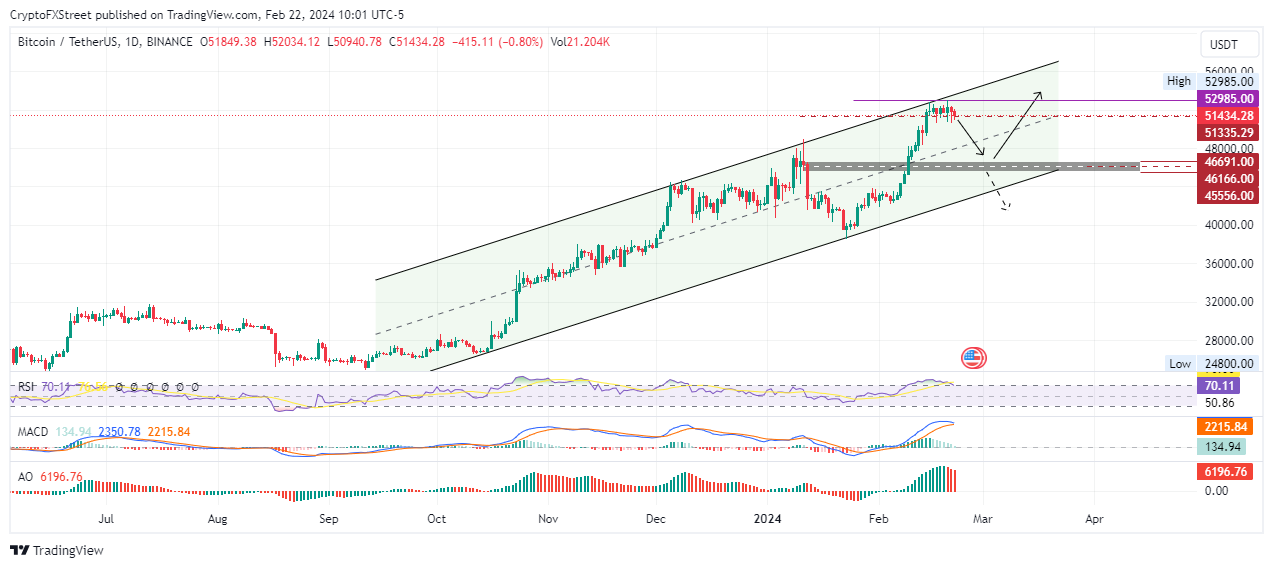
Meanwhile, as Bitcoin price’s horizontal consolidation continues, the market is slowly leaning to the downside. The price is testing the immediate support at $51,335 and could break below it as multiple technical indicators flash bearish.
To start with, the Relative Strength Index (RSI) has already executed a sell signal by crossing below its signal line (yellow band). The Moving Average Convergence Divergence (MACD) is also teasing with a potential bearish crossover below its signal line (orange line).
In addition, the histogram bars of the MACD are also fading as they edge toward negative territory. The same outlook is seen with the Awesome Oscillator (AO) histogram bars, flashing red as they edge toward the mean line.
If the $51,335 support gives in, Bitcoin price could drop, first losing the $50,000 milestone as support with the possibility of extending to the $48,000 level. In a dire case, the fall could see BTC retrace the $40,000 psychological level, almost 23% below current levels.
Also Read: Bitcoin back over $51K, crypto market recovers as Nvidia's earnings rejuvenates AI-tokens BTC/USDT 1-day chart
On the other hand, increased buying pressure could see Bitcoin price reclaim its range high of $52,985, last tested on February 20. Clearing this blockade could set the pace for Bitcoin price to extend past the $53,000 level. A break and close above this level would make $60,000 the next target for BTC. A test of this psychological level would denote a 17% climb above current levels.
Also Read: Top 3 Price Prediction Bitcoin, Ethereum, Ripple: Crypto market cowers with sell signals after FOMC minutes
CRYPTOCURRENCY METRICS FAQS
What is circulating supply?
The developer or creator of each cryptocurrency decides on the total number of tokens that can be minted or issued. Only a certain number of these assets can be minted by mining, staking or other mechanisms. This is defined by the algorithm of the underlying blockchain technology. Since its inception, a total of 19,445,656 BTCs have been mined, which is the circulating supply of Bitcoin. On the other hand, circulating supply can also be decreased via actions such as burning tokens, or mistakenly sending assets to addresses of other incompatible blockchains.
Bitcoin Price Prediction: Will Satoshi Nakamoto’s emails with early contributor shill BTC through the weekend?
- Bitcoin price has displayed a sustained downtrend over the past four days with lower highs and lower lows.
- BTC could revert to $50,000 amid low trading volumes and enhanced volatility characteristic of weekends.
- The bearish thesis will be invalidated if BTC breaks and closes above the $52,985 range high.
Bitcoin (BTC) price is testing a critical support level, that could confirm its next directional bias after three consecutive days of teasing with a downtrend. Meanwhile, the market has shelved matters Exchange-traded funds (ETFs) for a while, as all eyes peruse emails between BTC creator and one of his earliest collaborators.
Also Read: Top 3 Price Prediction Bitcoin, Ethereum, Ripple: Possible start of a trend reversal for BTC
Satoshi Nakamoto’s earliest collaborator comes forward on Bitcoin
In a recent post on X, one of Bitcoin creator Satoshi Nakamoto’s earliest collaborators, Martii 'Sirius' Malmi, shared emails among themselves. In the 120-page email history between them, Malmi revealed that Satoshi had envisioned the Bitcoin network having a maximum of 100,000 nodes. The latest data shows that the number of reachable nodes in the Bitcoin network typically range between 10,000 and 12,000.
The emails also reveal that Satoshi Nakamoto had anticipated more “newbies” and that BTC mining would be less energy intensive than the legacy banking system. Other highlights, as summarized by @pete_rizzo_, include:
- Satoshi foresaw at least one viable, non-monetary use for Bitcoin, backing the time-stamping use case.
- Satoshi was concerned about his legal risk in launching Bitcoin, noting he was "uncomfortable" with explicitly labeling it an investment.
- By July 2009, Satoshi was tired, saying he "needed a break" from Bitcoin.
- He believed in the easy adoption of Bitcoin, saying BTC was easy to obtain given that you could mine it on a computer.
- In June 2010, someone offered to donate $2,000 to Satoshi for his BTC work.
- The emails also reveal that Satoshi removed the language that Bitcoin was "anonymous" from http://Bitcoin.org.
We finally have a copy of the email Satoshi sent other developers before taking his name off the project website.
As they've said, Satoshi doesn't mention his intention to step back from the project at all ✨ pic.twitter.com/d78bx061A2
— Rizzo (@pete_rizzo_) February 23, 2024
Bitcoin price outlook as Satoshi’s emails to developer come to light
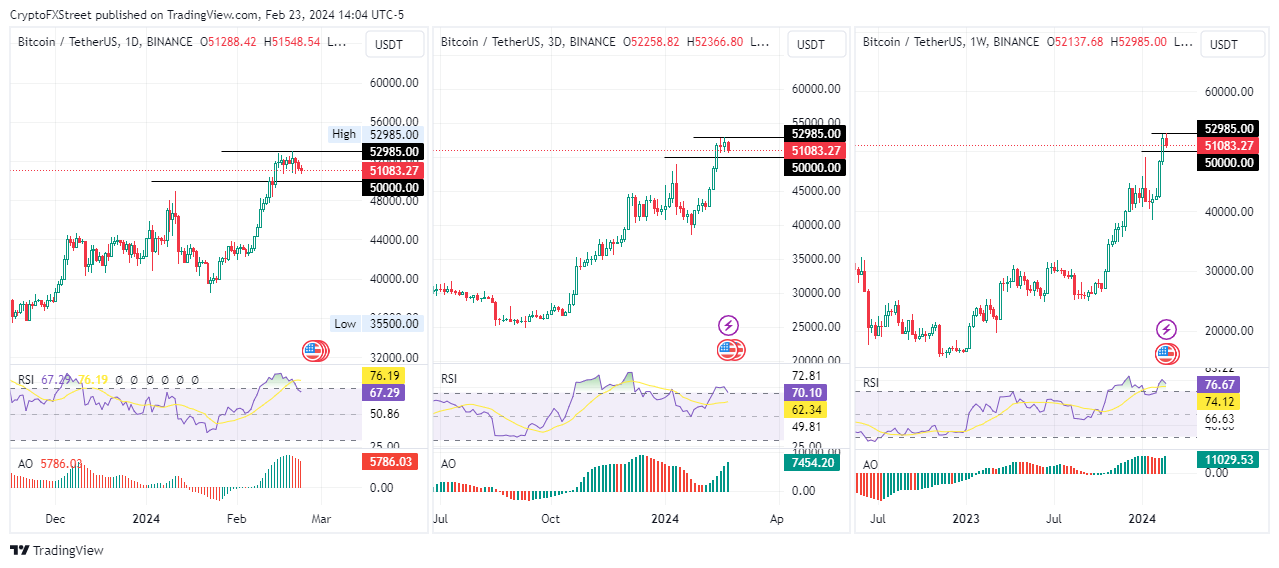
Bitcoin price is trading with a bearish tilt on the daily time frame, recording a series of lower highs and lower lows. On higher time frames, however, such as the three-day and the weekly timeframes, the outlook is rather indecisive.
With a bearish intermediate trend (daily time frame), the Relative Strength Index (RSI) shows Bitcoin price could drop further as momentum continues to decline. The histogram bars of the Awesome Oscillator (AO) have also turned red and are edging toward the midline.
Enhanced seller momentum could see Bitcoin price retest the $50,000 psychological level. An extended fall could send BTC to the $48,000 milestone, or in a dire case, extend a leg down to the $40,000 psychological level. Such a move would denote a 20% drop below current levels. BTC/USDT 1-day chart
On the flipside, enhanced buying pressure could see Bitcoin price break above the range by shattering the $52,985 roadblock. This would clear the way for BTC market value to reach $55,000, or in a highly bullish case, reach the $60,000 psychological level.
BITCOIN, ALTCOINS, STABLECOINS FAQS
What is Bitcoin?
Bitcoin is the largest cryptocurrency by market capitalization, a virtual currency designed to serve as money. This form of payment cannot be controlled by any one person, group, or entity, which eliminates the need for third-party participation during financial transactions.
What are altcoins?
What are stablecoins?
What is Bitcoin Dominance?
Share:
Share on Twitter
Share on Facebook
Copy to clipboard
Cryptos feed
Information on these pages contains forward-looking statements that involve risks and uncertainties. Markets and instruments profiled on this page are for informational purposes only and should not in any way come across as a recommendation to buy or sell in these assets. You should do your own thorough research before making any investment decisions. FXStreet does not in any way guarantee that this information is free from mistakes, errors, or material misstatements. It also does not guarantee that this information is of a timely nature. Investing in Open Markets involves a great deal of risk, including the loss of all or a portion of your investment, as well as emotional distress. All risks, losses and costs associated with investing, including total loss of principal, are your responsibility. The views and opinions expressed in this article are those of the authors and do not necessarily reflect the official policy or position of FXStreet nor its advertisers. The author will not be held responsible for information that is found at the end of links posted on this page.
If not otherwise explicitly mentioned in the body of the article, at the time of writing, the author has no position in any stock mentioned in this article and no business relationship with any company mentioned. The author has not received compensation for writing this article, other than from FXStreet.
FXStreet and the author do not provide personalized recommendations. The author makes no representations as to the accuracy, completeness, or suitability of this information. FXStreet and the author will not be liable for any errors, omissions or any losses, injuries or damages arising from this information and its display or use. Errors and omissions excepted.
The author and FXStreet are not registered investment advisors and nothing in this article is intended to be investment advice.
Join Telegram
BNB price eyes $400 as Binance Coin bulls keep showing up
- Binance Coin is consolidating within a descending parallel channel, which has precipitated a bullish breakout before.
- BNB could hit $400 soon, 5% above current levels as bulls continue to show up.
- The bullish thesis would be invalidated by a break and close below $360.00.
Binance Coin (BNB) price has formed lower highs and lower lows over the past few days, but the bulls continue to maintain a strong presence in the market. BNB has also steadfastly shown strength despite the recent uncertainty in the market as altcoins awaited cues from Bitcoin (BTC) price.
Also Read: Binance likely to be monitored for up to five years, CZ’s sentence could be less than 18 months
BNB price eyes 5% gains
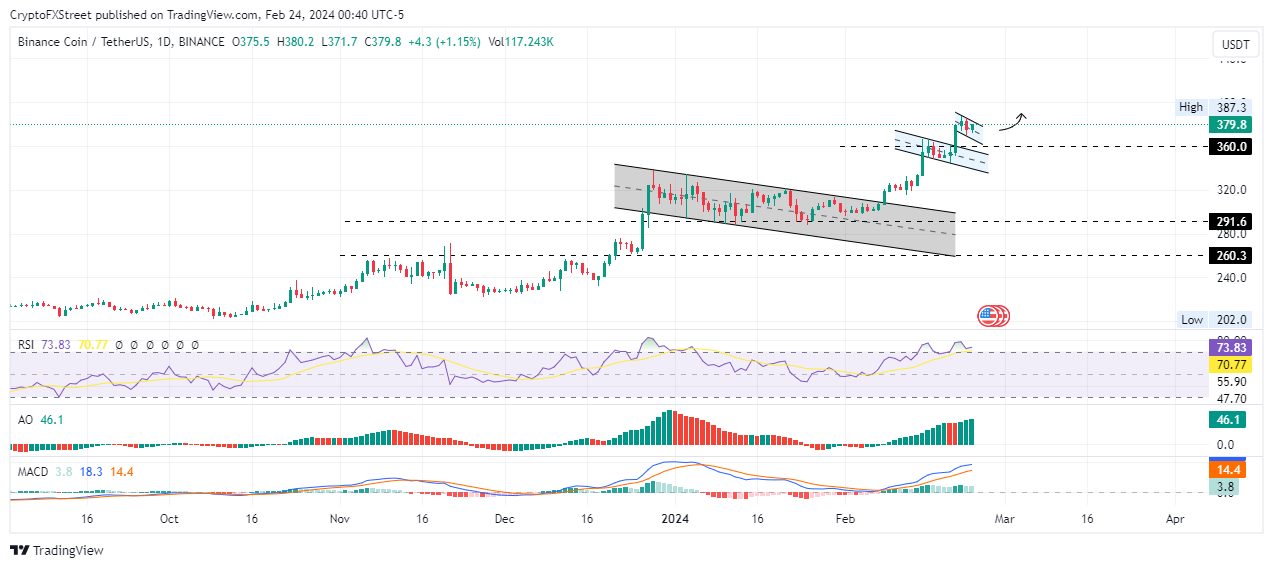
Binance Coin (BNB) price is trading with a bearish bias, consolidating within a descending parallel channel. However, this technical formation has historically proven to be a healthy correction for BNB. This coupled with the strength seen in the altcoin even when markets were showing weakness, inspires optimism.
If history rhymes, the Binance Coin price could break above the upper boundary of the descending parallel channel, clearing the $387.30 range high before making a 5% climb to the $400.00 psychological level.
Notice the Relative Strength Index (RSI) remains northbound despite BNB being overbought already. The Moving Average is also suggesting a renewed bullish wave as it moves above the signal line (orange band). Its histogram bars, just like those of the Awesome Oscillator (AO), remain in positive territory, accentuating the bullish thesis. BNB/USDT 1-day chart
On the other hand, with BNB already overbought, the altcoin’s price is at high risk of a correction. The histogram bars of the MACD are also losing their green shade, suggesting the bears are gaining strength in the BNB market.
If the bulls show weakness, the bears could take over. This could see Binance Coin price break below the $360.00 support. This would invalidate the bullish thesis, setting up BNB for an extended fall.
Share:
Share on Twitter
Share on Facebook
Copy to clipboard
Cryptos feed
Information on these pages contains forward-looking statements that involve risks and uncertainties. Markets and instruments profiled on this page are for informational purposes only and should not in any way come across as a recommendation to buy or sell in these assets. You should do your own thorough research before making any investment decisions. FXStreet does not in any way guarantee that this information is free from mistakes, errors, or material misstatements. It also does not guarantee that this information is of a timely nature. Investing in Open Markets involves a great deal of risk, including the loss of all or a portion of your investment, as well as emotional distress. All risks, losses and costs associated with investing, including total loss of principal, are your responsibility. The views and opinions expressed in this article are those of the authors and do not necessarily reflect the official policy or position of FXStreet nor its advertisers. The author will not be held responsible for information that is found at the end of links posted on this page.
If not otherwise explicitly mentioned in the body of the article, at the time of writing, the author has no position in any stock mentioned in this article and no business relationship with any company mentioned. The author has not received compensation for writing this article, other than from FXStreet.
FXStreet and the author do not provide personalized recommendations. The author makes no representations as to the accuracy, completeness, or suitability of this information. FXStreet and the author will not be liable for any errors, omissions or any losses, injuries or damages arising from this information and its display or use. Errors and omissions excepted.
The author and FXStreet are not registered investment advisors and nothing in this article is intended to be investment advice.
Join Telegram


![[ℕ𝕖𝕧𝕖𝕣] 𝕊𝕖𝕝𝕝 𝕐𝕠𝕦𝕣 𝔹𝕚𝕥𝕔𝕠𝕚𝕟 - And Now What.... Pray To The God Of Hopium?](https://cdn.bulbapp.io/frontend/images/79e7827b-c644-4853-b048-a9601a8a8da7/1)


![[LIVE] Engage2Earn: McEwen boost for Rob Mitchell](https://cdn.bulbapp.io/frontend/images/c798d46f-d3b8-4a66-bf48-7e1ef50b4338/1)


