Trading 101: Unlocking the Secret Rules of Support and Resistance Levels

Support and resistance levels are fundamental tools that traders use to analyze the markets. They are key areas where price action is expected to react in a particular way, either by reversing or continuing the trend. Mastering how to correctly draw your support and resistance levels is crucial to successful trading. In this article, we will delve into the details of how to draw support and resistance levels correctly and how to apply them in your trading strategy.There are several principles involved in identifying support/ resistance levels, as elaborated below.
What are Support and Resistance Levels?
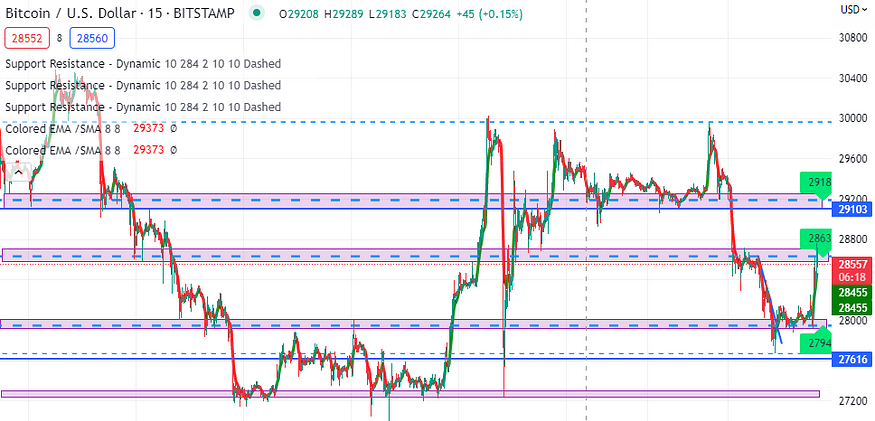
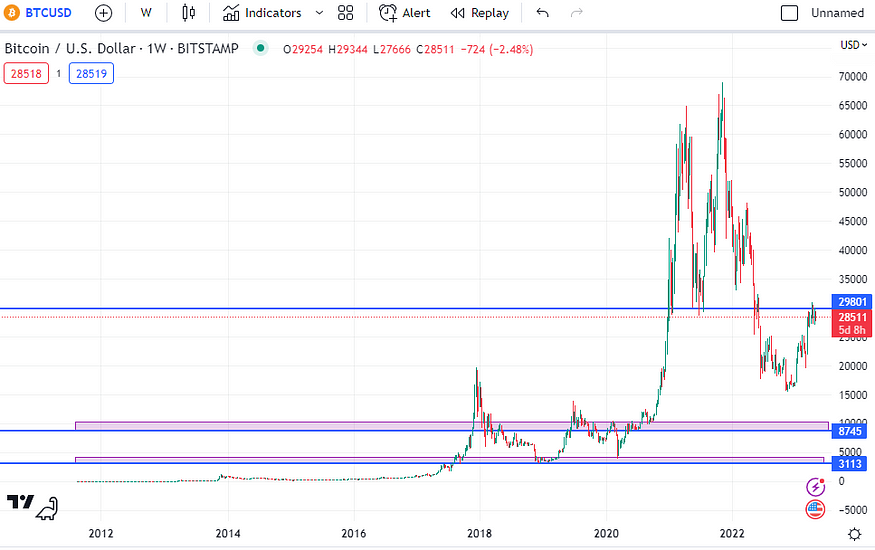
The market moves in cycles that are shaped by a hierarchical structure of levels., where the price of an asset is likely to experience a significant reversal. Simply put, support levels are price levels where buying pressure is expected to increase and push prices higher, while resistance levels are those levels where selling pressure is expected to increase and push prices lower. These levels are typically represented by horizontal lines on price charts as shown below.
To draw a support level, you need to identify a significant low on the chart from where the price of the asset bounced higher. You can then draw a straight line across the chart at that price level. The more times the price has bounced from that level, the stronger the support level is likely to be. Likewise, to draw a horizontal resistance level, you need to identify a significant high on the chart where the price of the asset bounced lower. You can then draw a straight line across the chart at that price level. The more times the price has bounced from that level, the stronger the resistance level is likely to be.
The Importance of Support and Resistance Levels
Support and resistance levels are important because they provide traders with information about market sentiment and market structure. Knowing these key levels can help traders identify potential trading opportunities, manage risk, and make informed decisions about when to enter and exit trades.
#1 Support and resistance levels are not straight lines
Support and resistance levels represent a range of price, rather than a series of lines, and would be more accurately reflected by the diagram below.
#2 Multiple rejections
Look for multiple rejections at a particular price level, which occur when price tests a level several times but fails to break through it. Traders can draw a horizontal line at these levels to represent support or resistance.
For example, in the chart below, price tested the resistance level three times before reversing down, indicating that it is a strong level of resistance.
#3 Support and resistance can flip
It is important to bear in mind while drawing support and resistance levels, that support and resistant levels are dynamic — when a support level is broken, it can turn into a resistance level, and when a resistance level is broken, it can turn into a support level.
For example, in the chart below, we can see that price broke through the support level and then retested it from below, now acting as a resistance level.
#4 Swing highs and lows
Look for swing highs and lows in the chart. A swing high is the highest point in an uptrend, while a swing low is the lowest point in a downtrend. Traders can draw a horizontal line at these levels to represent support or resistance.
For example, in the chart below, we can see that price formed a swing high and moved away from it significantly before reversing down. This indicates that the level is a strong resistance level.
#5 Levels identified should be near the current price
While drawing support and resistance levels, ensure that they are near the current price. Drawing levels too far away from the current price can make them less relevant, while having too many lines on a chart can make it confusing. Traders should only draw the levels that matter right now, which are the recent price movements.
#6 Too many cooks spoil the soup
 While it may be tempting to embark on a line-drawing spree on the chart, it is important to avoid drawing too many lines as it can be confusing. You should focus mainly on the primary key levels that matter, from which price has bounded off the most number of times.
How To Trade Supply and Resistance?
Sell at resistance; buy at support!
While the general principle above still holds true, it is important to look for other confluent features in the chart before entering a trade, such as price action and momentum, moving average crossover, RSI and so forth.
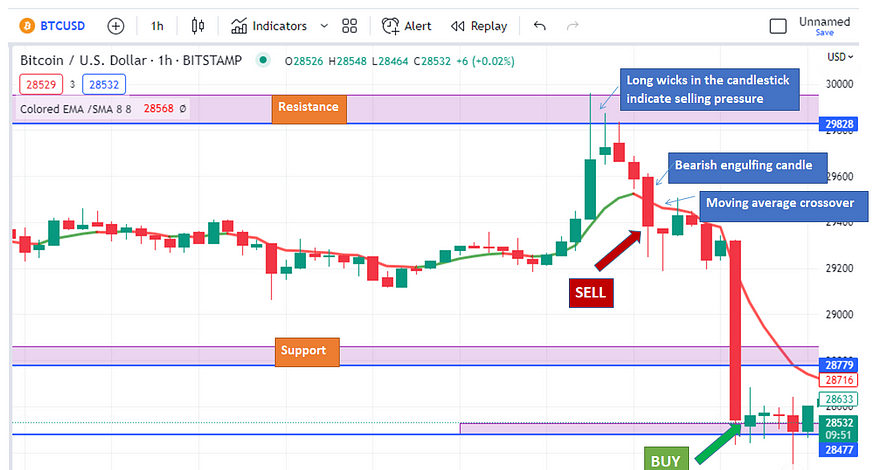
In this example above of BTC/USD on an hourly timeframe, there are several points to support opening a short at $30k, including:
- Price rejection as evidenced by multiple long wicks at a key resistance level.
- Formation of a bearish engulfing candlestick.
- Price crossing below the moving average.
One can therefore open a short position as above, placing a take profit at the next key level of $28.5k and also a stop loss above the $30k level (for capital preservation in the event of a fake-out).
As such, only place trades when they are near a key resistance/ support level in conjunction with other features in the chart, most notably price action. Do not “force” a trade when price does not show a clear direction of movement; patience is a virtue.
Final Thoughts
In conclusion, correctly identifying support and resistance levels is a crucial part of a profitable trading strategy. Following the key principles mentioned above can significantly improve your win rate trade opportunities.
TradingView is an indispensable and versatile tool to facilitate trading in a wide variety of markets, offering various free and paid plans with discounts of up to $30 which you can avail here.
What are your thoughts on this? Feel free to leave your comments below; and follow me for more future articles in this trading series as we embark on a learning adventure of trading together! ★Free apps to earn money without any capital!★
🎁 Honeygain A passive income app to earn money off your unused internet bandwidth. Get $3 for free, no investment required.
🎁 Grass An innovative web-based platform that rewards you for sharing your unused network resources.
🎁 IPRoyal Pawns A passive income app to earn money off your unused internet bandwidth.
🎁 EarnApp A passive income app to earn money off your unused internet bandwidth.
🎁 Peer2Profit A passive income app to earn money off your unused internet bandwidth.
🎁 JumpTask Earn free crypto when you complete microtasks!
🎁 CryptoTab Earn free Bitcoin while surfing the internet!
🎁 Bitcoin Faucet Sites: FreeBitco.in, Cointiply
🎁 StormX: Earn crypto as you shop online!
★Cryptocurrency Investment/ Trading Platforms★
🎁 Bake A one-stop investment platform that bakes passive cashflow at APYs of up to 100%! Get a $50 bonus in DFI with a $50 deposit.
🎁 Nexo An advanced, regulated digital assets institution offering instant crypto loans, daily earning on assets with APYs of up to 36%, an exchange, with services in 40+ fiat currencies in more than 200 jurisdictions. Get a $25 bonus with a $100 deposit.
🎁 Binance The world’s largest cryptocurrency exchange that needs no introduction!
🎁 Bitget A leading cryptocurrency exchange offering free advanced trading bots and copy trading.
🎁 Kucoin An expansive cryptocurrency exchange, with interesting offerings like staking, free trading bots and bitcoin cloud mining services.
🎁 HTX A cryptocurrency exchange with diverse offerings, free airdrops and trading bots.
🎁 MEXC A cryptocurrency exchange with interesting listings and frequent airdrops from holding the MX token.
🎁 Crypto.com A cryptocurrency exchange based in Singapore. Get $25 in CRO on staking for a Ruby card.
🎁 TradingView An invaluable charting platform for various markets. Get up to $30 discount off a paid plan here!
★Cryptocurrency Trading Bots★
🎁 3Commas A cryptocurrency trade management platform offering DCA bots, Grid bots, Options bots, Futures bots, HODL bots, Scalper Terminal, and full Portfolio management all from a single convenient interface.
🎁 Jet-bot An advanced spot and futures trading bot with Copy Trading functionality. 3-day trial period available with demo account.
🎁 Pionex A free multifunctional arbitrage trading bot that automates the process of buying low and selling high, 24/7.
🎁 Wundertrading An automated cryptocurrency trading bot offering a 7 day trial period with full functionality.
🎁 One Click Crypto An AI bot powered by neural networks that manage your cryptocurrency portfolio on autopilot.
★For Malaysian investors★
🎁 Luno Get a RM75 bonus in BTC with a RM250 purchase of BTC!
🎁 Stashaway Get free investing for 6 months!
🎁 Wahed code ‘KENLIE1’ RM10 signup bonus!
🎁 Capbay P2P code ‘8879c6’ RM100 signup bonus!
🎁 Versa Get a RM10 bonus with a RM100 deposit!
🎁 KDI Get a RM10 bonus with a RM250 deposit!
🎁 Klook Get a RM15 signup bonus!
Connect with me Medium | Read.cash | Publish0x | BulbApp | YouTube | Twitter


