Cardano (ADA) Price Hits Local Bottom and Now Aiming at US$1, Can It Be Achieved?
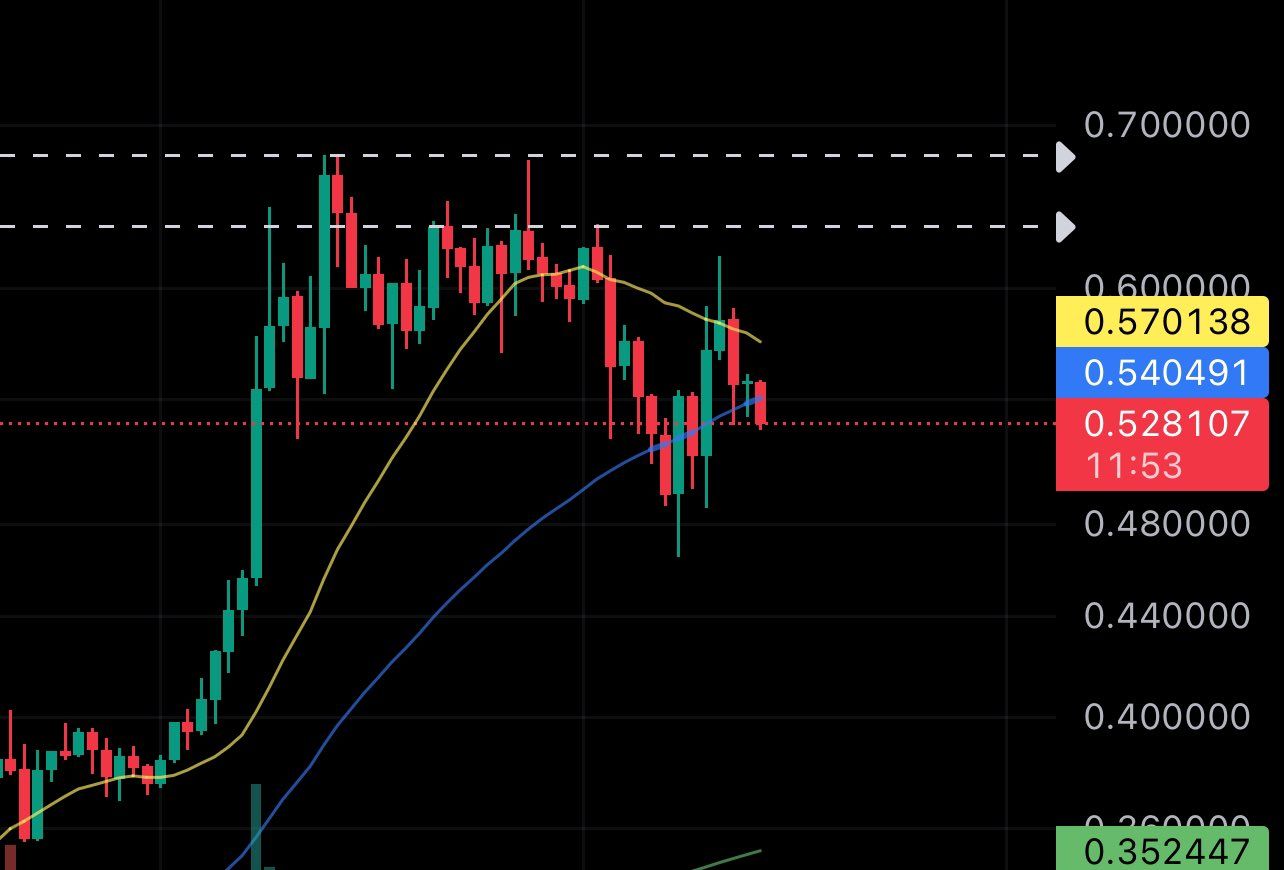
The price of Cardano (ADA) briefly soared last week, but ultimately failed to maintain most of its gains.
Now, ADA is still trying to break the descending resistance trendline that has held for 33 days.
Cardano Bounces after Breakout
ADA price has been trading within a horizontal range since November 2022, with support and resistance levels confirmed several times.
In October 2023, ADA has started a rapid upward action . This upward movement then succeeded in breaking through this range in the following month and at the same time set a new annual peak at US$0.68 in December.
Even though it had to be corrected afterwards, this altcoin was able to bounce at the upper limit of this range last week. As a result, ADA closed last week on a bullish note , but left a long upper wick.
Traders generally use the Relative Strength Index ( RSI) as a momentum indicator to identify potential overbought or oversold conditions . From here, they can make decisions in the form of accumulation or sale of an asset.
An RSI reading above 50 and an uptrend indicates that the lead is still in favor of the bulls , while a reading below 50 indicates the opposite.
ADA's weekly RSI presents mixed, aka ambiguous, signals. This is because the indicator is falling, but is still hovering above 50. This indicates the presence of a hidden bullish divergence pattern (green), a signal related to the continuation of the current trend.
Here's What Analysts Say
Even though discussion about ADA on platform
The dAppAnalyst estimates that ADA will experience a parabolic increase after breaking through the price range of US$0.60-US$0.70.
Can ADA Price Afford a Breakout ?
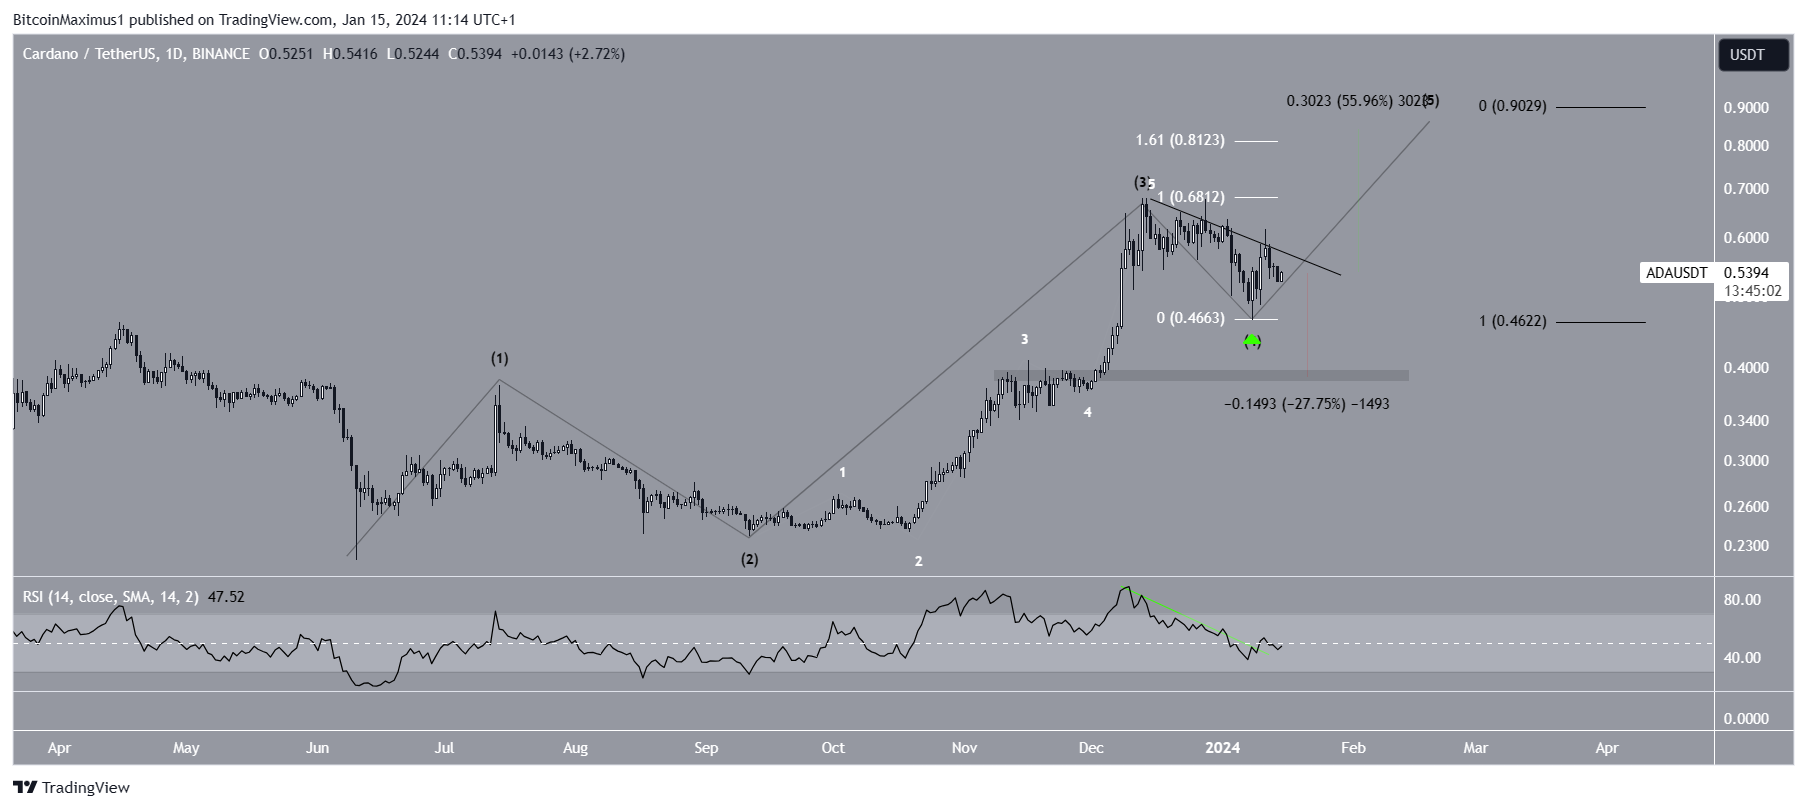
The daily time frame chart supports the continuation of the ADA price upward trend . The wave count and RSI indicator readings both provide bullish trend signals .
Technical analysts use Elliott Wave theory to determine trend direction. This theory involves the study of recurring long-term price patterns and investor psychology.
The wave count currently depicted shows that ADA is in the fifth and final wave of its rise which began in June 2023 (black). Meanwhile, the fifth wave started on January 8 (green icon).
To confirm this wave count , ADA must break the descending resistance trendline .
If successful, ADA has the potential to rise as much as 55% towards the next resistance in the range of US$0.80-US$0.90. This range is formed by the 1.61 external retracement of wave four (white) and wavelength one (black).
Moreover, the daily RSI is in line with this possibility as it has managed to break the existing trend line (green).
Even though the ADA price prediction has a bullish tone , downward action below the US$0.46 level will cancel this wave count . In such a scenario, ADA would slip 28% towards the nearest support at US$0.40.


![[LIVE] Engage2Earn: auspol follower rush](https://cdn.bulbapp.io/frontend/images/c1a761de-5ce9-4e9b-b5b3-dc009e60bfa8/1)


