Toncoin rides out Bitcoin’s slump as it ends week with 30% hike
 Dipayan Mitra
Journalist
Edited By: Ann Maria Shibu
Posted: March 17, 2024
Share this article
- Buying pressure on Toncoin was high.
- Market indicators mostly looked bearish on TON.
Toncoin [TON] has been able to hold its ground well in the bear market as its weekly chart remained green. Since TON’s performance over the last week looked remarkable, AMBCrypto planned to have a look at its metrics to see whether this trend would last.
Toncoin’s price action is favoring investors
AMBCrypto reported a few days ago about TON’s bull rally. Our report pointed out how Toncoin’s value managed to go up by over 30% in just 24 hours.
A few days after TON’s bull rally began, Bitcoin’s [BTC] price crashed, causing the market to turn bearish. However, TON was not affected greatly as its weekly chart continued to remain green.
According to CoinMarketCap, TON was up by over 32% in the last seven days. At press time, TON was trading at $3.81 with a market capitalization of over $13.24 billion, making it the 13th largest crypto.
Interestingly, despite the positive price action, TON’s weighted sentiment dropped, which meant that bearish sentiment around TON was slowly rising. Its social volume also went down, indicating that investors were not talking about the token. 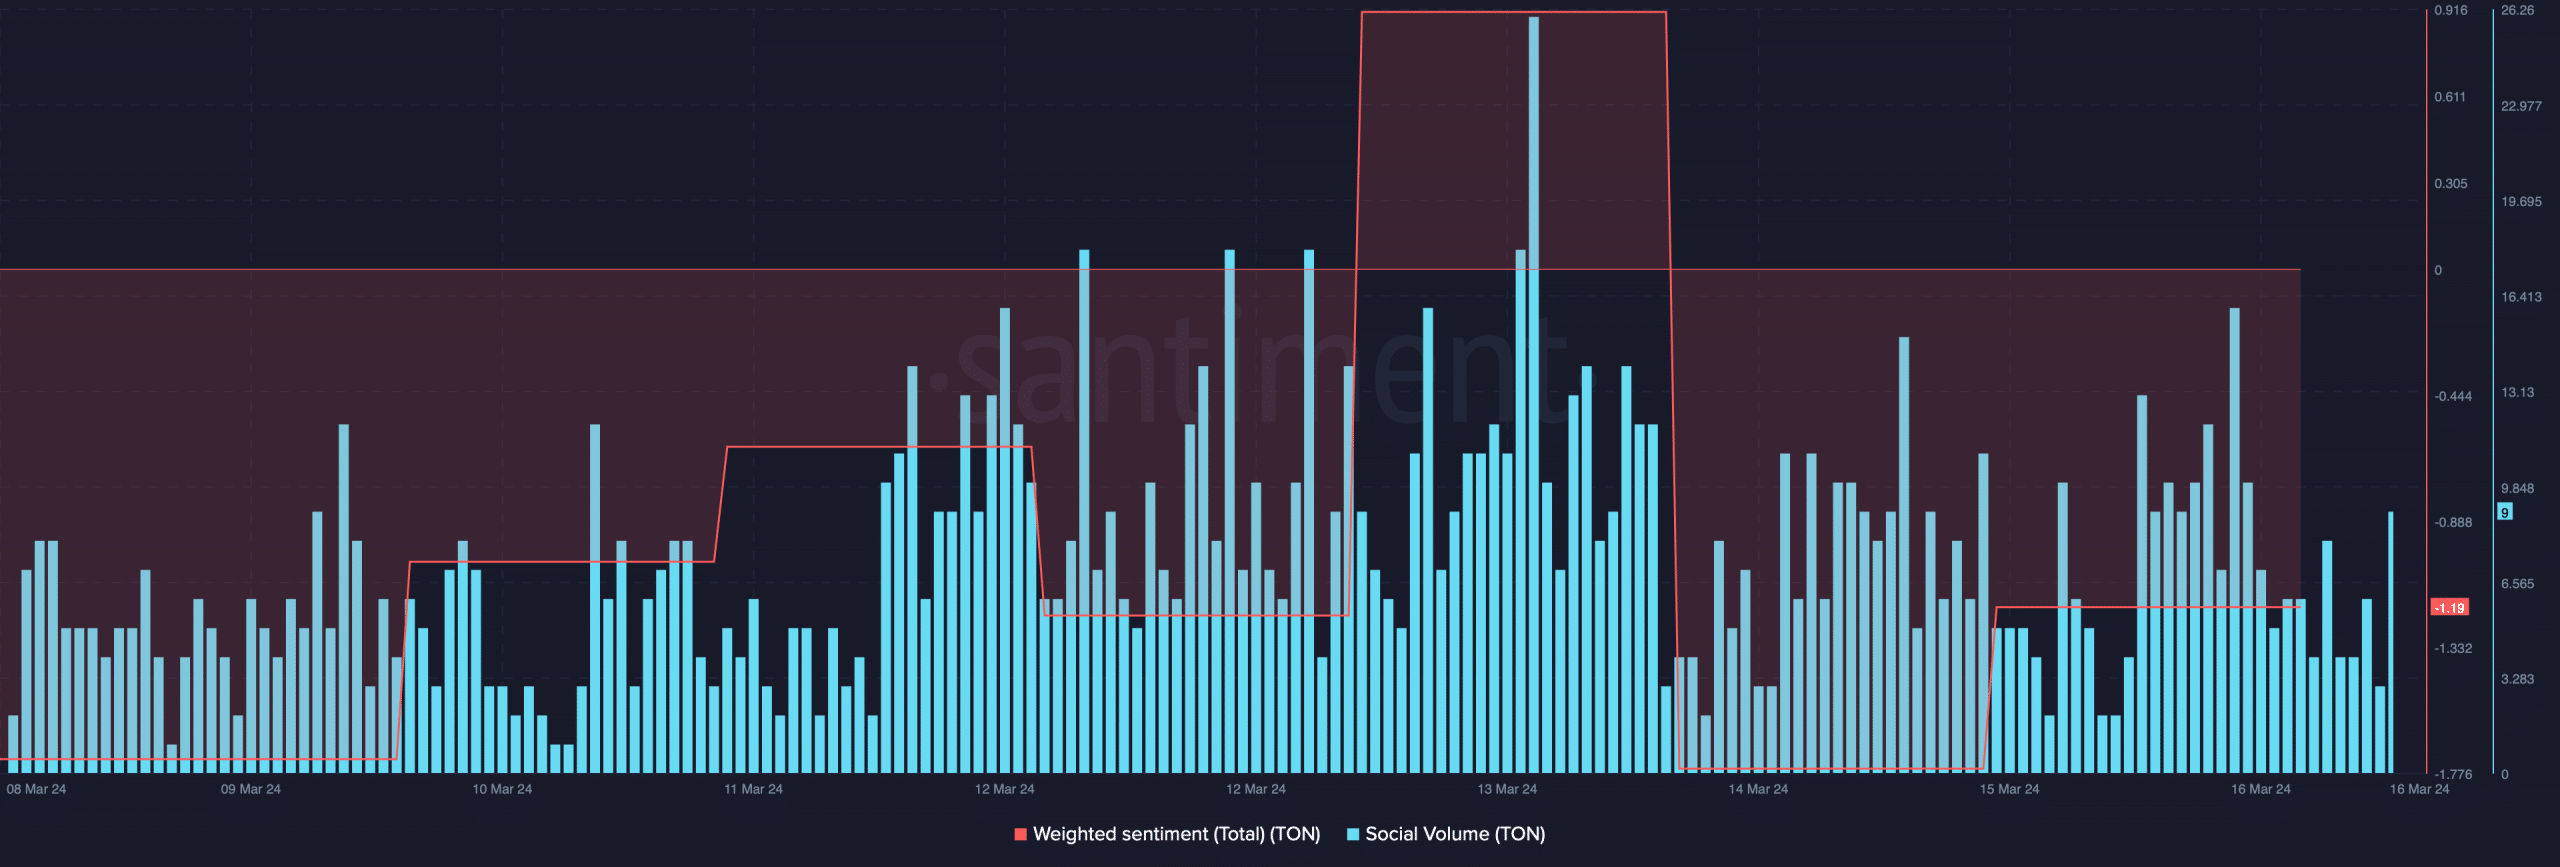 Source: Santiment
Investors are buying Toncoin
Since TON’s price action looked optimistic, AMBCrypto took a look at its metrics to see whether investors should expect another bull rally.
Our analysis of Santiment’s data revealed that buying pressure on Toncoin was high. This was evident from the rise in its supply outside of exchange and the dip in its supply on exchanges.
However, the big players in the market were selling TON as its supply held by addresses went down in the last few days. 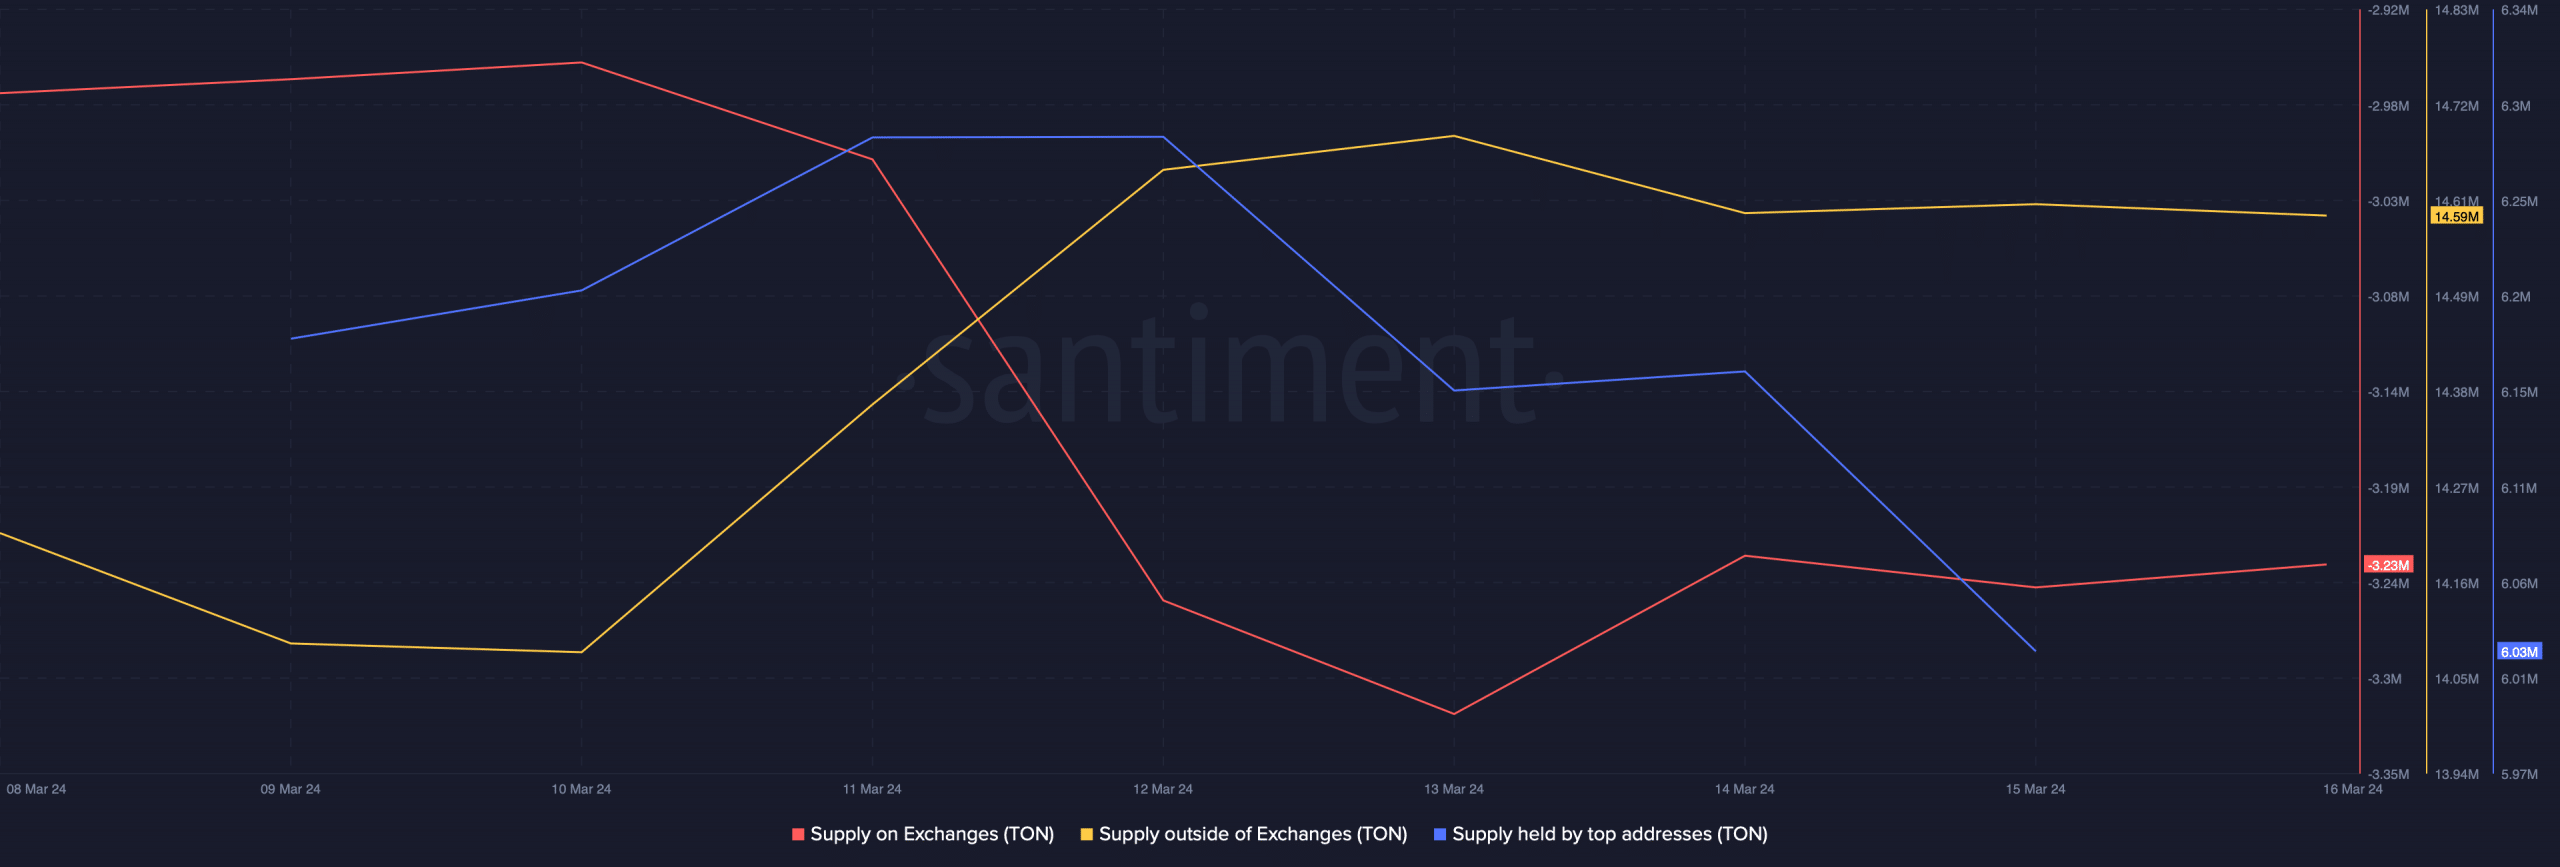 Source: Santiment
After a sharp rise, TON’s network activity dropped last week. As per our analysis of Santiment’s data, TON’s daily active addresses plummeted after spiking on the 13th of March.
Additionally, its network growth also sank along with active addresses. This meant that fewer addresses were used to transfer the token. A similar trend was also noted in terms of volume, as the metric dipped by more than 35% in the last 24 hours. 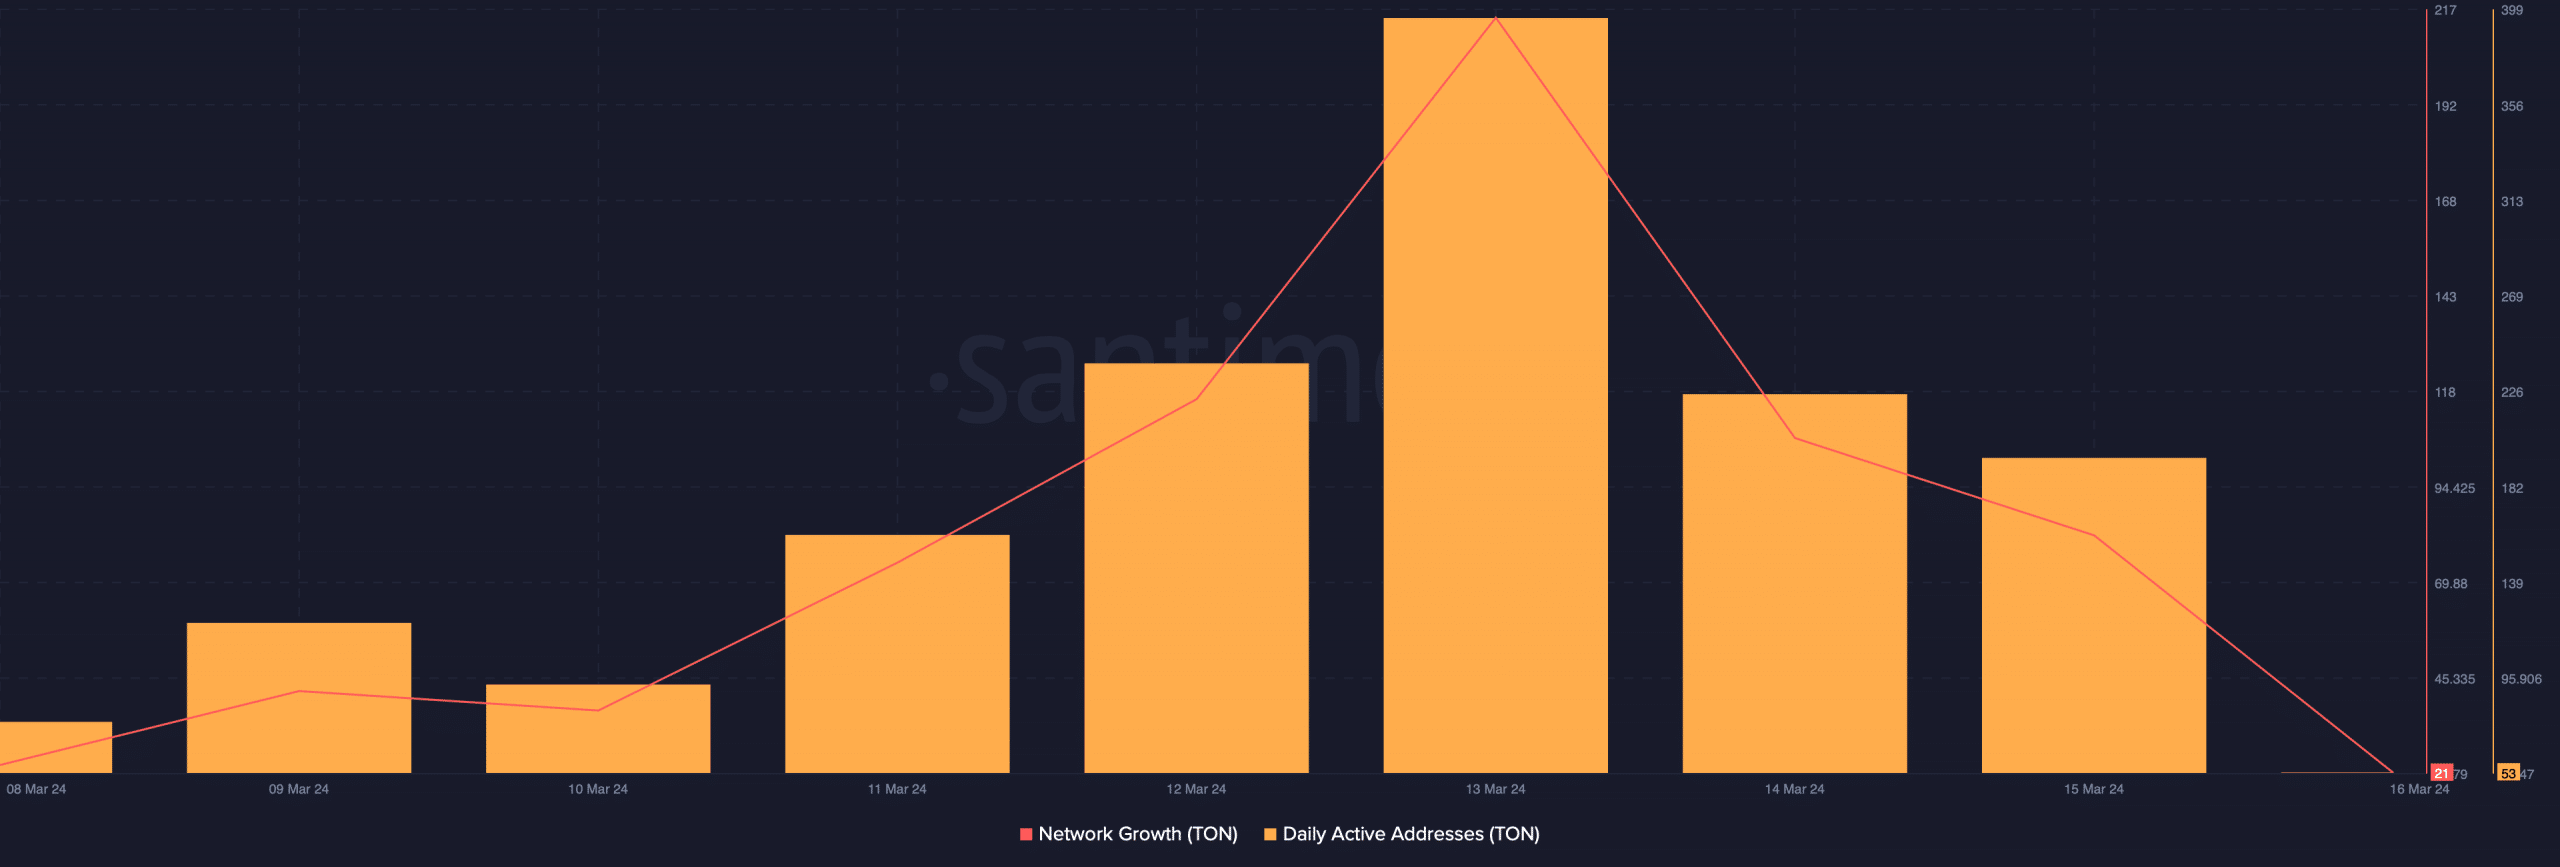 Source: Santiment
How much are 1,10,100 TONs worth today?
Though buying pressure on Toncoin was low, technical indicators suggested that investors might witness a few slow-moving days. Its Chaikin Money Flow (CMF) took a sideways path.
The Relative Strength Index (RSI) also registered a sharp downtick. Nonetheless, the MACD supported the buyers as it displayed a clear bullish upperhand in the market. 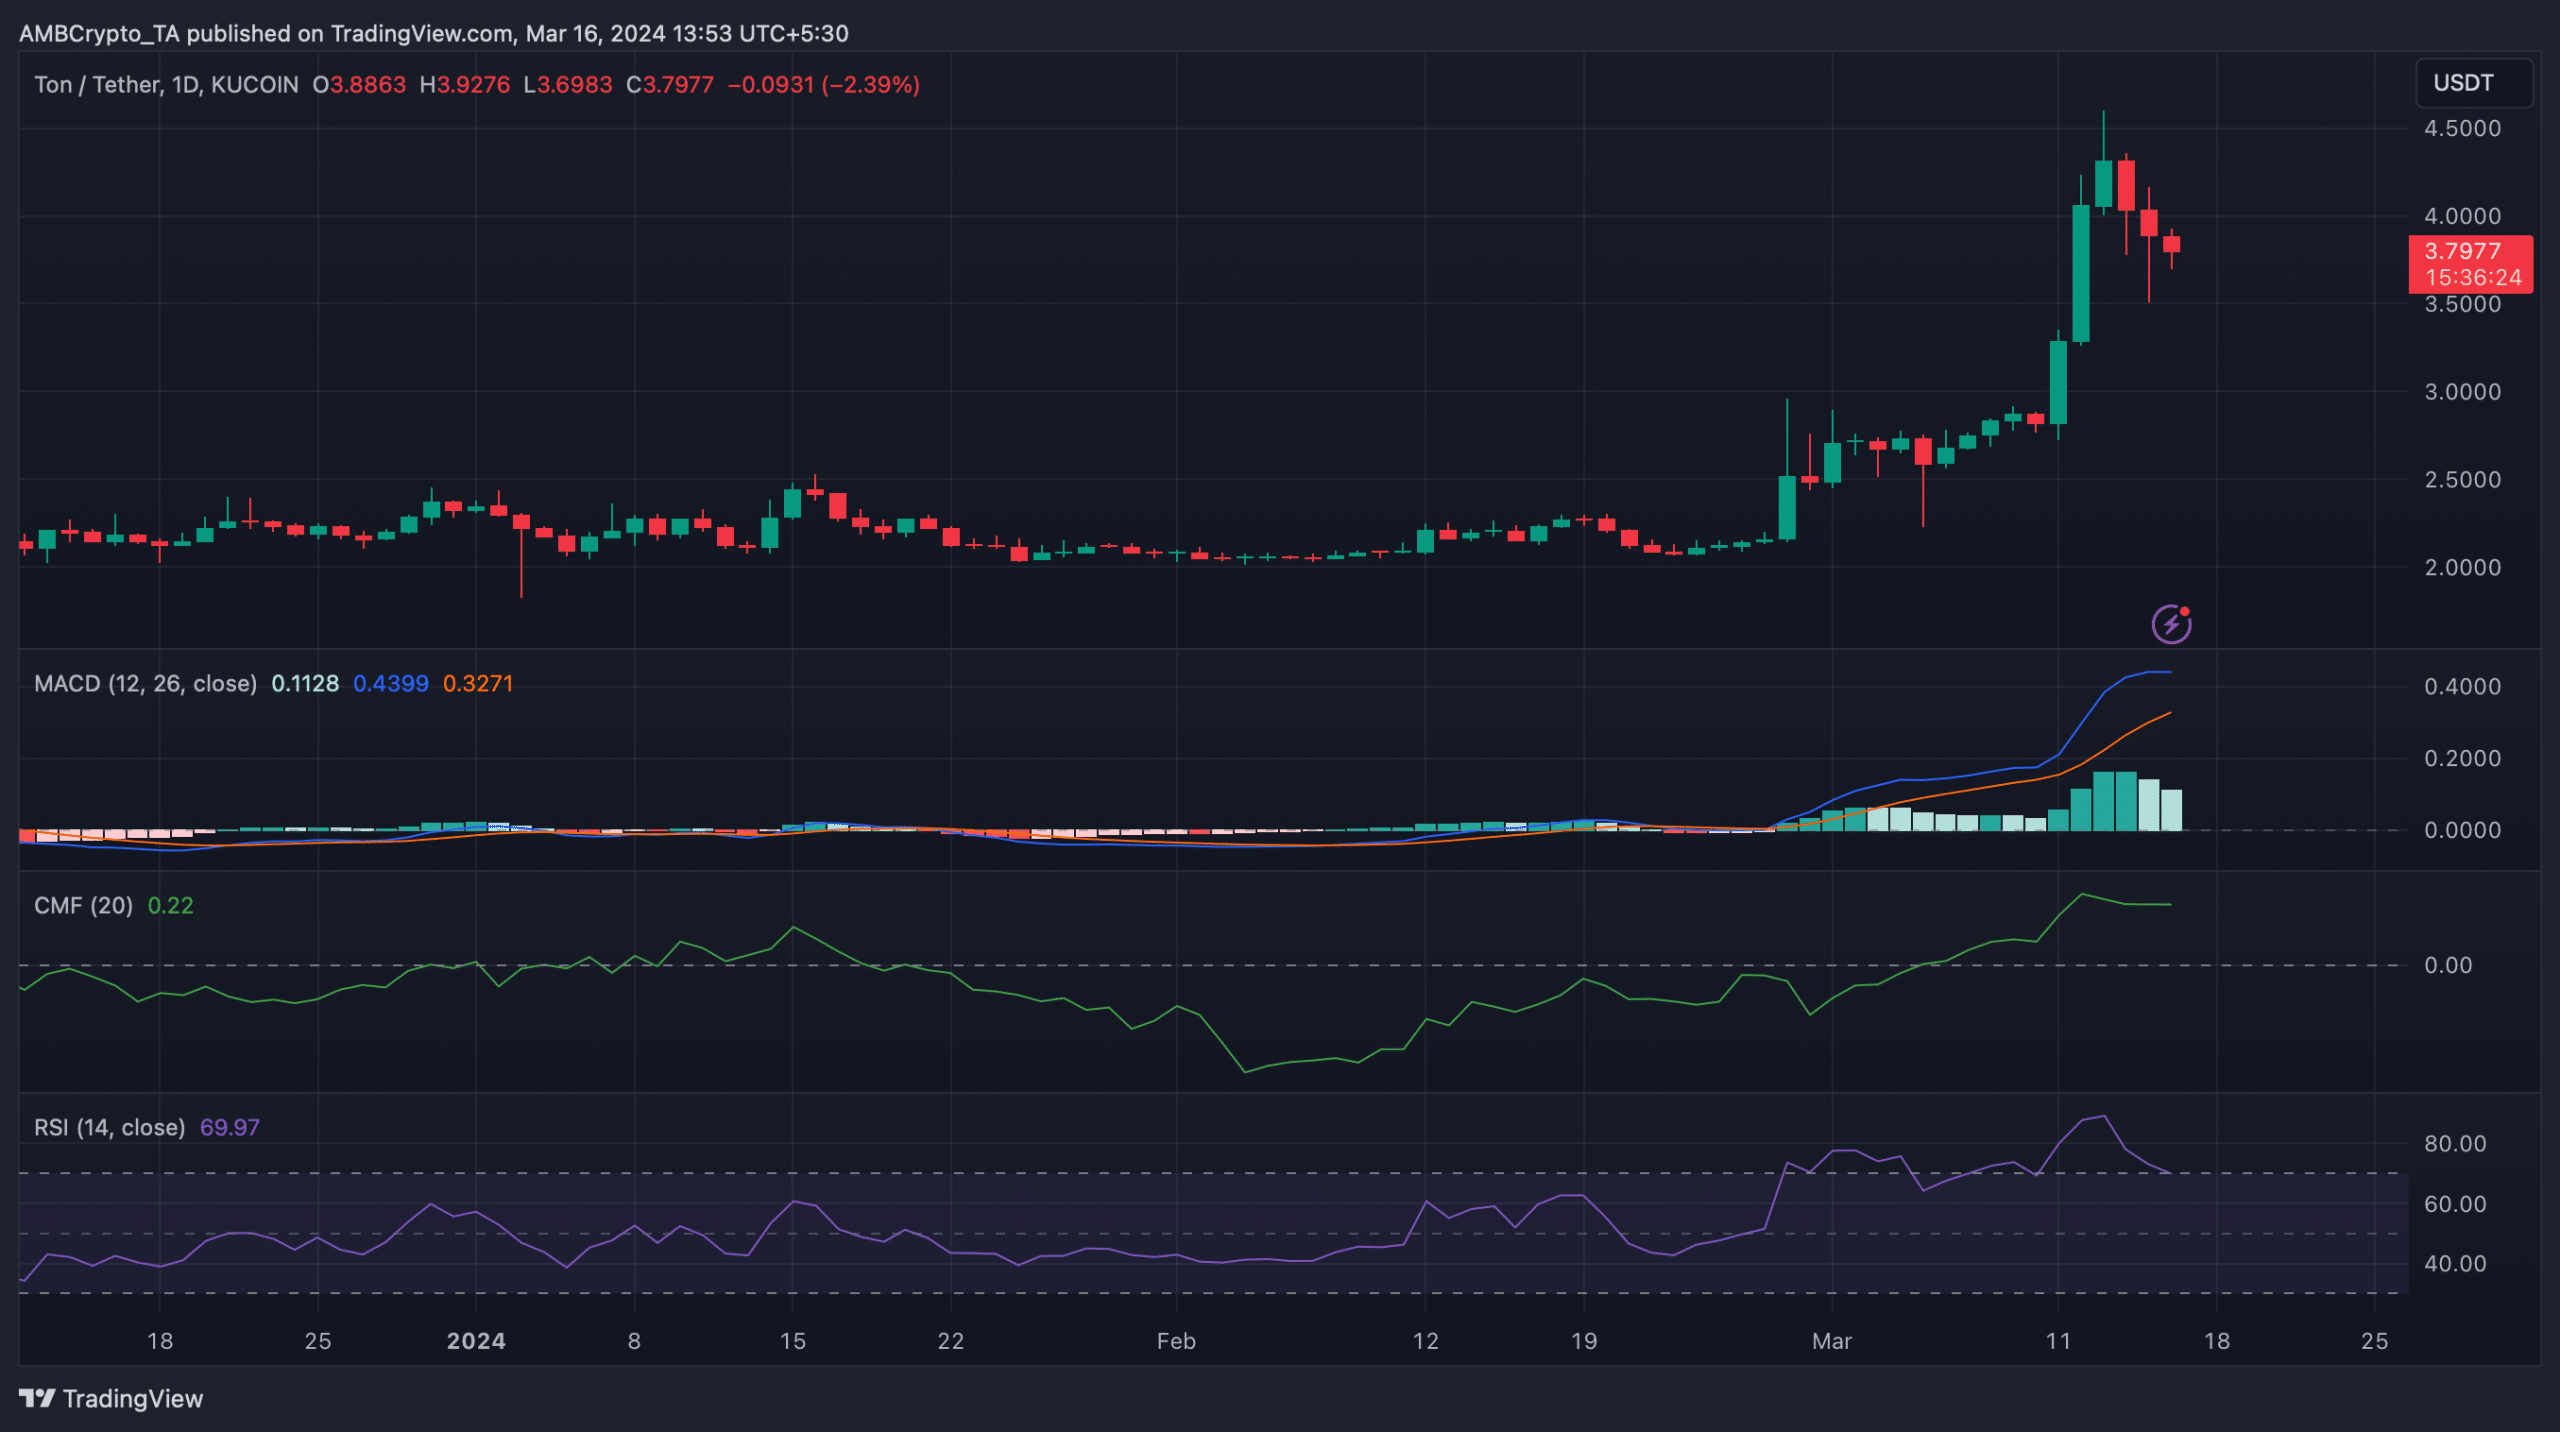 Source: TradingView
Follow AMBCrypto on Google News
Previous: Ethereum could drop as low as $3100 – Time to rethink your moves?
Next: Ethereum: Will fresh demand again push ETH past $4K?
Read the Next Article
Ethereum: Will fresh demand again push ETH past $4K?
2min Read
The daily count of new addresses created on the Ethereum network recently surged to a year-to-date high.

 Abiodun Oladokun
Journalist
Edited By: Ann Maria Shibu
Posted: March 17, 2024
Share this article
- New demand for Ethereum now sits at a year-to-date high.
- Its DeFi and NFT sectors, however, witnessed declines in the past week.
The daily count of new addresses on Ethereum [ETH] assessed on a seven-day moving average reached a year-to-date (YTD) high of 116,000 on 14th March, according to The Block’s data dashboard. Source: The Block
This marked a 35% increase from the 86,000 unique addresses that appeared for the first time in a transaction of the native coin in the network on 1st January.
Ethereum’s rally in new demand to a YTD high came amidst a surge in its on-chain volume. AMBCrypto found that transaction volume on the network, also assessed using a seven-day moving average, attained a YTD high of $7 billion on 11th March.
As transaction volume rallied, the average fee paid per transaction on the network also climbed. According to The Block’s data, this reached a YTD high of $25 on 11th March.  Source: The Block
The DeFi and NFT sector fails to react
Despite the recent uptick in demand for the Ethereum network, its decentralized finance (DeFi) and non-fungible token ecosystems have witnessed declines.
For example, the total value of assets locked (TVL) across the DeFi protocols housed within the chain declined by 5% in the last week. Per DefiLlama’s data, Ethereum’s TVL was $53.4 billion.
Out of the top 10 DeFi protocols on Ethereum, only one (ether.Fi) recorded a TVL hike in the past seven days. The rest of them witnessed a decline.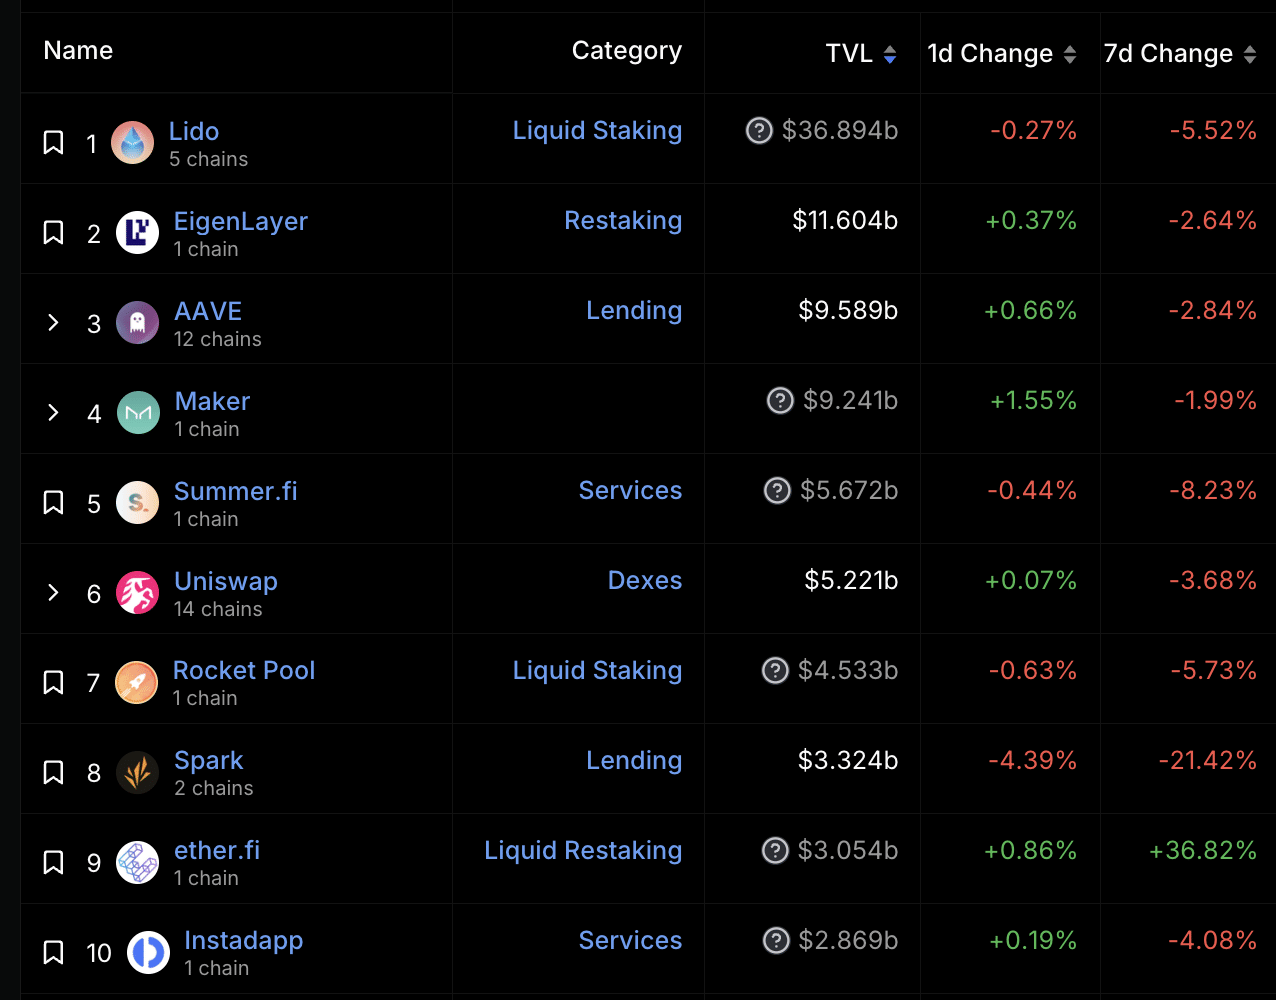 Source: DefiLlama
The network’s NFT sector recorded a 21% decrease in sales volume in the last seven days.
According to CryptoSlam’s data, despite the 90% uptick in the number of traders trading NFTs on the network during that period, the transaction count fell by 2%.
In the last seven days, 166,000 NFT transactions worth $130 million were completed on the Ethereum network.
Look before you leap
The network’s native coin ETH sold for $3,721 at press time. Per CoinMarketCap’s data, its value dropped by 6% in the last week. The decline followed a sharp fall in Bitcoin’s value on 14th March, when its value was below $68,000.
How much are 1,10,100 ETHs worth today?
An assessment of ETH’s performance on a daily chart revealed that its Awesome Oscillator (AO) indicator has posted red upward-facing histogram bars since 11th March.
An asset’s AO measures market trends and changes in momentum. When it displays red upward-facing bars, it suggests increasing negative momentum in the market. Traders often interpret this as a signal to consider selling or entering short positions.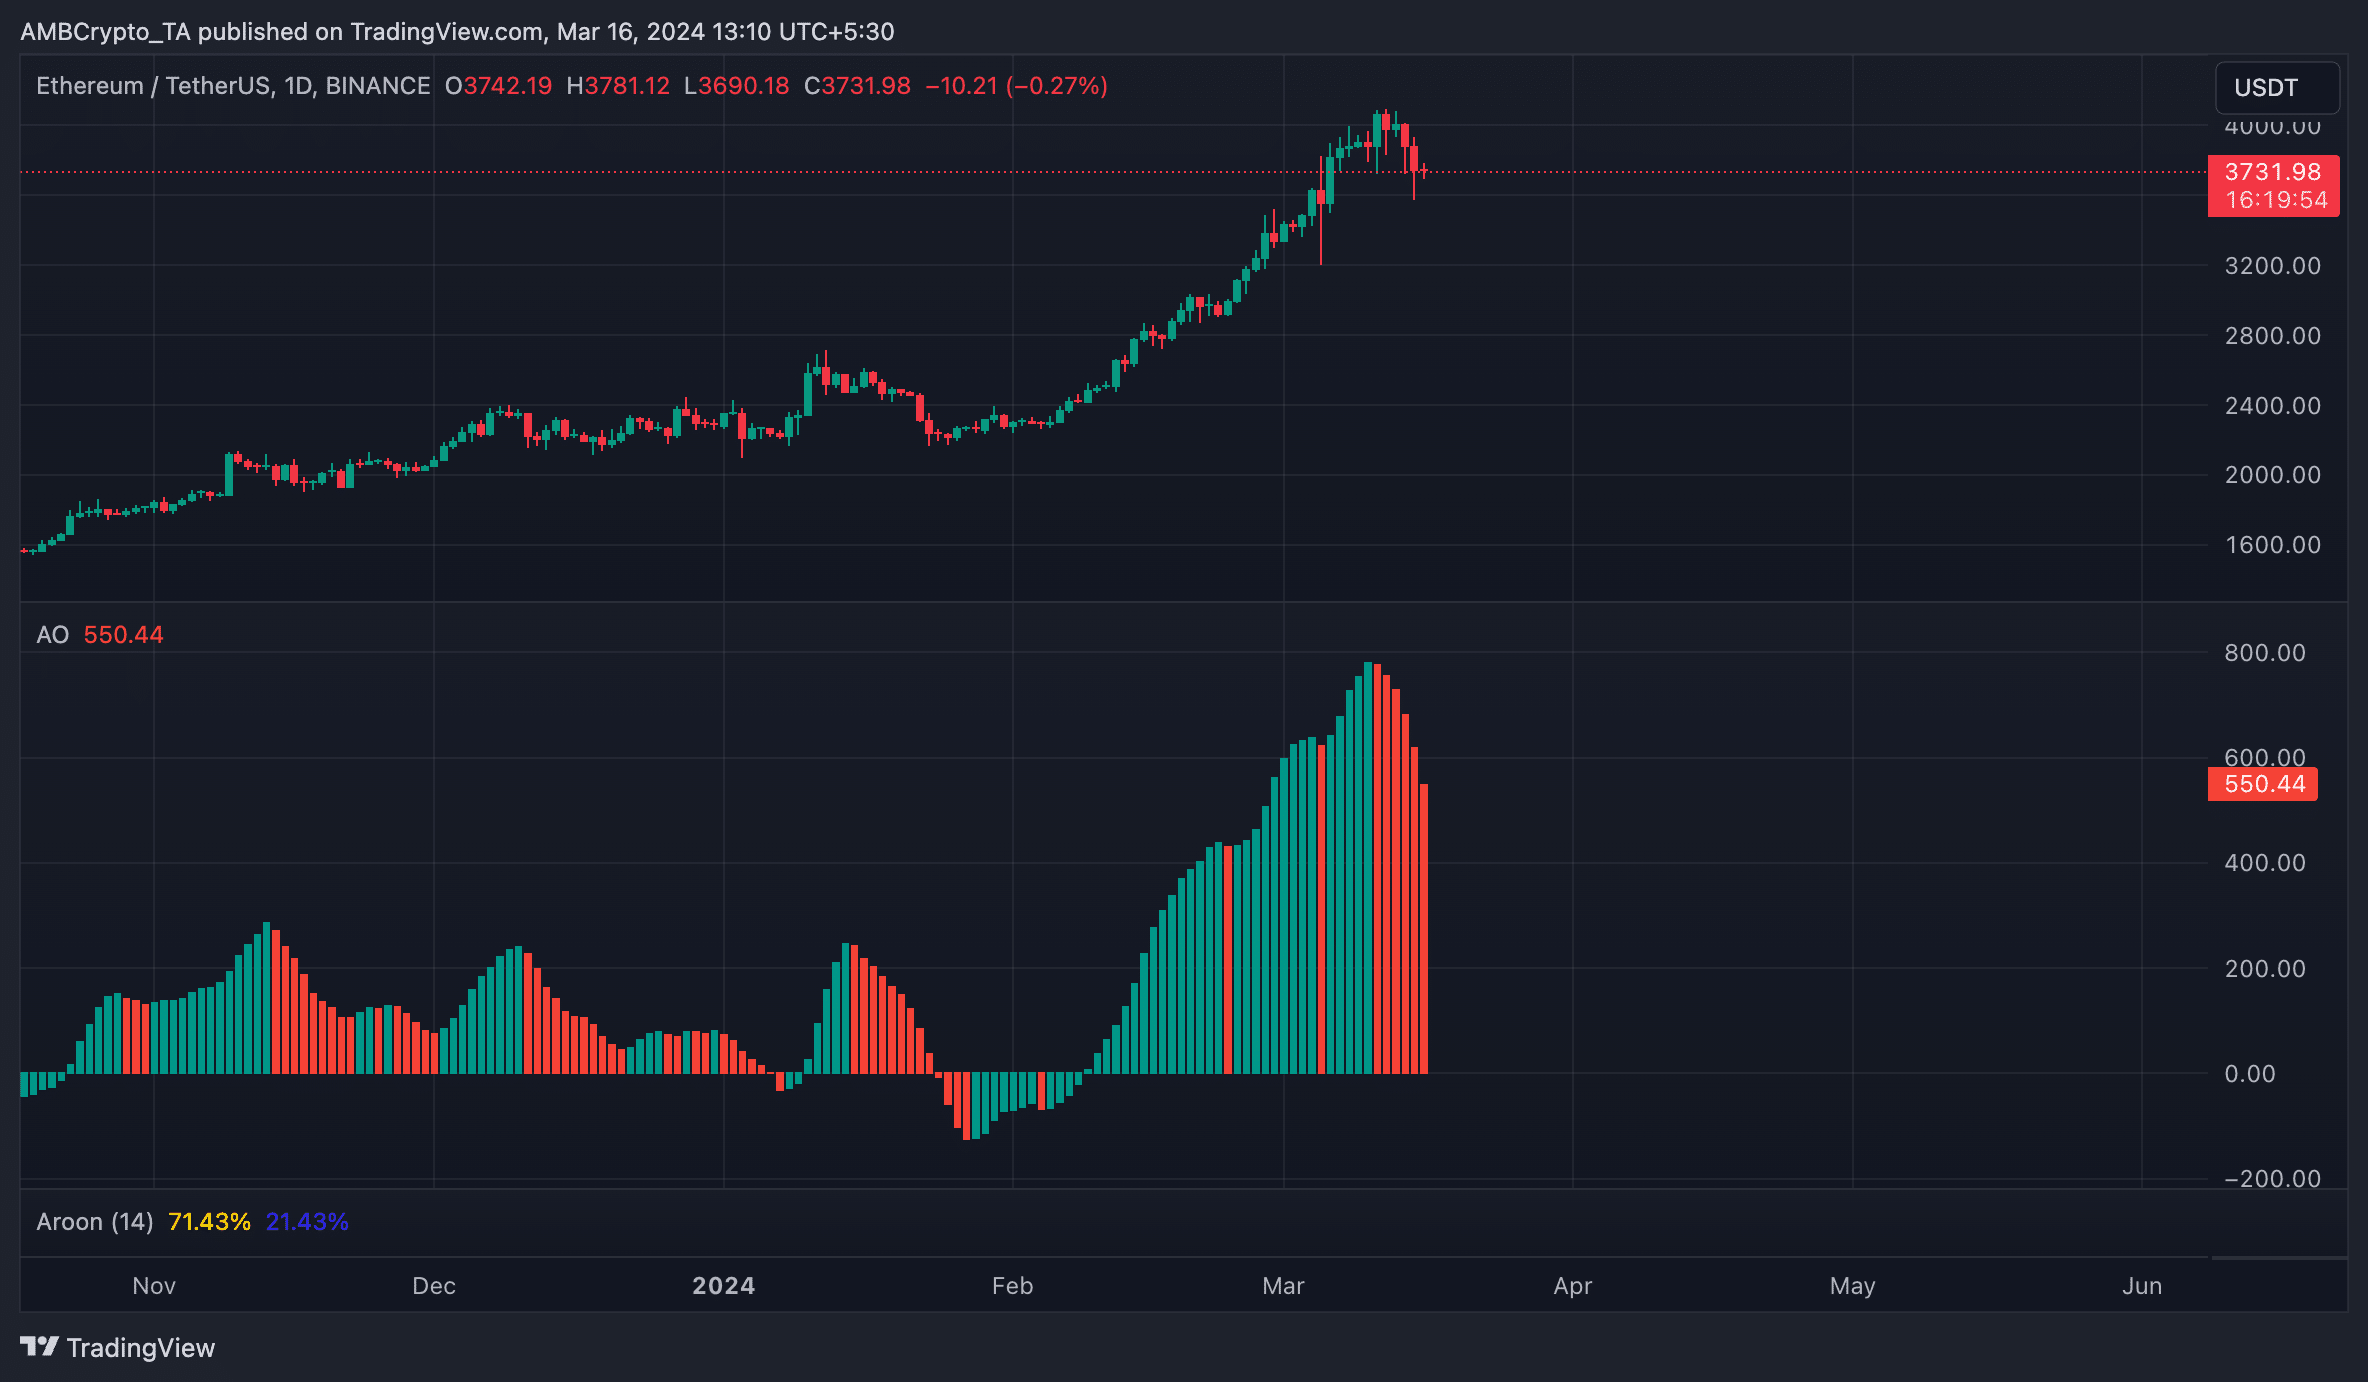 Source: TradingView

![[ℕ𝕖𝕧𝕖𝕣] 𝕊𝕖𝕝𝕝 𝕐𝕠𝕦𝕣 𝔹𝕚𝕥𝕔𝕠𝕚𝕟 - WEN ALT Season?](https://cdn.bulbapp.io/frontend/images/5e881bda-7f7a-42c8-9a03-01263004c332/1)


