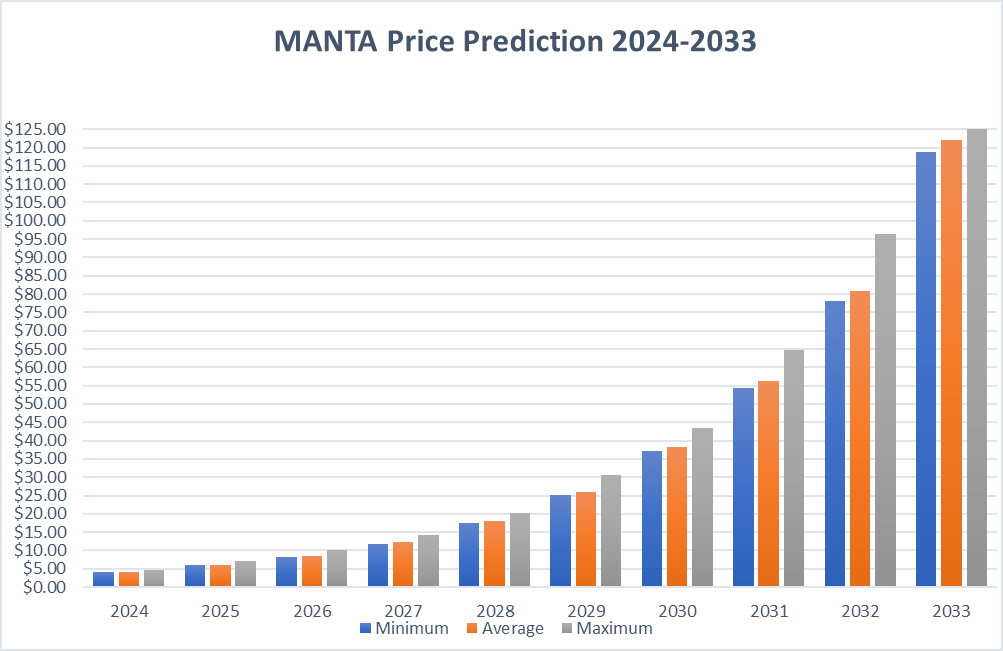
MANTA Price Prediction 2024-2033: Will Manta Network Survive Or Crash?

INTRODUCTION
How Much Is Manta Worth?
As of today, the current price of Manta Network is $2.72, with a 24-hour trading volume of $528.50M. It has a market cap of $683.72M and holds a market dominance of 0.04%. In the last 24 hours, the MANTA price has seen a decline of -7.30%.
Manta Network achieved its highest value on January 28, 2024, trading at an all-time high of $3.87. The record for its lowest price is not available, but it once traded at a nominal all-time low of $0.00. Since reaching its all-time high, the lowest price it has seen was $2.67 (cycle low), while the highest price post the last cycle low was $2.72 (cycle high). The current market sentiment for Manta Network is bullish, with the Fear & Greed Index indicating 60 (Greed).
Currently, Manta Network has a circulating supply of 251.00M MANTA, with a maximum supply cap of 1.00B MANTA. In the Layer 2 sector, Manta Network ranks at #26 in terms of market capitalization.
MANTA Price Analysis
Manta price continues to struggle in gaining buying demand
- MANTA price analysis shows a bearish pattern after witnessing selling demand near $3.2
- Resistance for Manta is present at $3.2
- Support for MANTA/USDT is present at $2.64
The MANTA price analysis for 4 February confirms that Manta witnessed a bearish pressure as it faced selling around $3.2-$3. However, buyers continue to defend a decline below the immediate support channel.
Manta price analysis 1-day chart: Bulls failed to meet buying goals
Analyzing the daily price chart of MANTA token, Manta’s price witnessed a bearish rally after bulls failed to push the altcoin above $3.2. Over the last 24 hours, Manta price has been on a bearish path as sellers continue to exit positions, sending the price to test immediate support lines. The 24-hour volume surged to $78.6 million, showing an increased interest in trading activity today. Manta price is currently trading at $2.7, decreasing by over 8.4% in the last 24 hours.
The RSI-14 trend line has declined from its previous level and currently hovers around 55-level, showing that bulls are slowly losing the momentum of the price. The SMA-14 level suggests upward volatility in the next few hours.
Manta/USDT 4-hour price chart: Bulls aim for a surge above EMA20
The 4-hour Manta price chart suggests MANTA continues to experience bearish activity near EMA lines, creating a negative sentiment on the price chart. As the price continues to decline below EMA lines, bulls are aiming to stabilize the price and trigger a correction above the EMA20 trend line.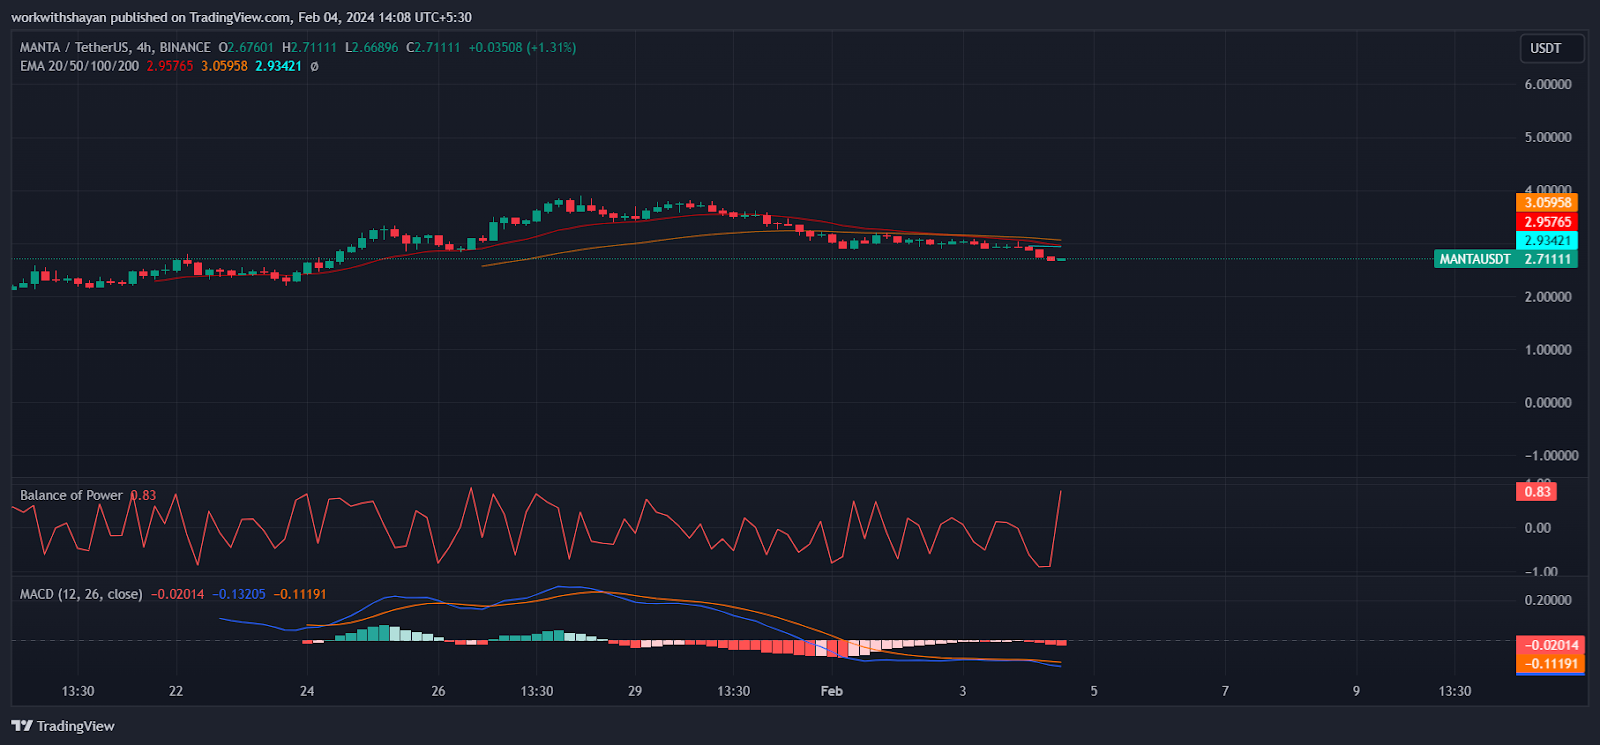
However, the MACD trend line has formed red candles below the signal line and the indicator aims for a negative momentum, strengthening bearish positions.
What to expect from Manta price analysis next?
The hourly price chart confirms bears are making efforts to prevent the Manta price from an immediate surge. However, if the Manta price successfully breaks above $3.2, it may surge higher and touch the resistance at $3.9.
If bulls cannot initiate a surge, Manta price may drop below the immediate support line at $2.64, resulting in a correction to $2.12.
Recent MANTA News/Opinions
DDoS Attack: The emerging Manta Network experienced a distributed denial of service (DDoS) attack during the issuance of its MANTA token, resulting in delayed withdrawals and slowed network performance. Manta developers acknowledged in an X post that a significant backlog of transactions was causing extended transaction times and affecting gas fees.


![[LIVE] Engage2Earn: McEwen boost for Rob Mitchell](https://cdn.bulbapp.io/frontend/images/c798d46f-d3b8-4a66-bf48-7e1ef50b4338/1)


![[ℕ𝕖𝕧𝕖𝕣] 𝕊𝕖𝕝𝕝 𝕐𝕠𝕦𝕣 𝔹𝕚𝕥𝕔𝕠𝕚𝕟 - And Now What.... Pray To The God Of Hopium?](https://cdn.bulbapp.io/frontend/images/79e7827b-c644-4853-b048-a9601a8a8da7/1)


