Bitcoin Struggles to Break Above Resistance, Price Hovers at $64,000

Bitcoin price recovered and climbed above the $64,000 resistance zone. BTC is now facing hurdles near the $65,500 and $66,000 levels.
- Bitcoin is now struggling to gain pace for a move above the $65,500 resistance zone.
- The price is trading above $64,000 and the 100 hourly Simple moving average.
- There is a key contracting triangle forming with resistance at $65,100 on the hourly chart of the BTC/USD pair (data feed from Kraken).
- The pair could start a fresh surge if it clears the $65,500 resistance zone.
Bitcoin Price Starts Increase
Bitcoin price found support above $60,000 and started a fresh increase. BTC climbed above the $62,500 and $63,500 resistance levels. The bulls even pushed the price above the $65,000 level.
However, the bears seem to be active near the $65,500 zone. The recent high was formed at $65,598 and the price is now consolidating gains. There was a drop below the $65,000 level, but the price is still above the 23.6% Fib retracement level of the upward move from the $59,666 swing low to the $65,598 low.
Bitcoin price is trading above $64,000 and the 100 hourly Simple moving average. Immediate resistance is near the $65,100 level. There is also a key contracting triangle forming with resistance at $65,100 on the hourly chart of the BTC/USD pair.
The first major resistance could be $65,500. The next resistance now sits at $66,000. If there is a clear move above the $66,000 resistance zone, the price could continue to move up. In the stated case, the price could rise toward $67,500.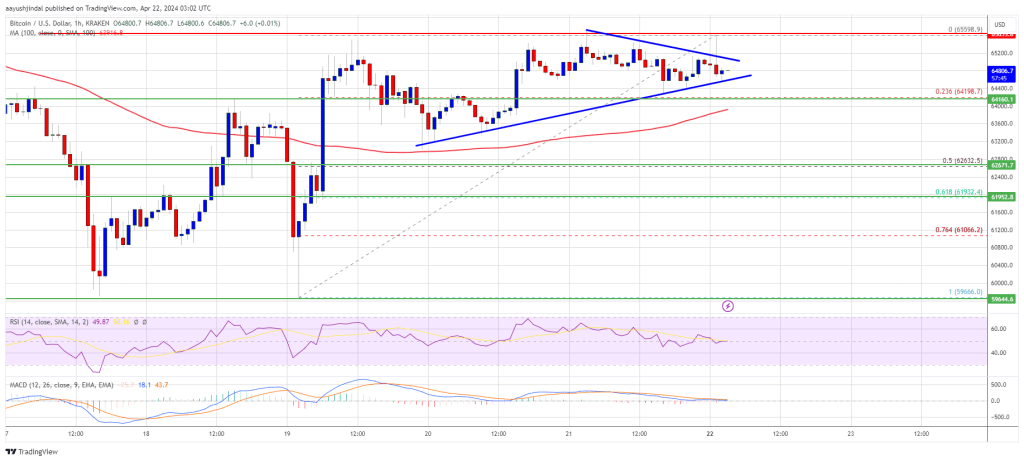 Source: BTCUSD on TradingView.com
The next major resistance is near the $68,500 zone. Any more gains might send Bitcoin toward the $70,000 resistance zone in the near term.
Downside Correction In BTC?
If Bitcoin fails to rise above the $65,500 resistance zone, it could start a downside correction. Immediate support on the downside is near the $64,500 level.
The first major support is $64,000. If there is a close below $64,000, the price could start to drop toward the 50% Fib retracement level of the upward move from the $59,666 swing low to the $65,598 low at $62,500. Any more losses might send the price toward the $61,200 support zone in the near term.
Technical indicators:
Hourly MACD – The MACD is now losing pace in the bullish zone.
Hourly RSI (Relative Strength Index) – The RSI for BTC/USD is now near the 50 level.
Major Support Levels – $64,500, followed by $64,000.
Major Resistance Levels – $65,100, $65,500, and $66,000.
Bitcoin Price Struggle Continues
Bitcoin price started another increase above the $61,500 resistance zone. BTC cleared the $62,500 and $63,000 resistance levels. It even spiked above $64,000 but failed to surpass the key level at $65,000.
A high was formed at $64,142 before there was a sharp decline. There was a break below a connecting bullish trend line with support at $62,400 on the hourly chart of the BTC/USD pair. It dived below the $60,800 level and retested $59,650.
A low was formed near $59,666 and the price is now attempting a fresh recovery wave. The price climbed above the 23.6% Fib retracement level of the recent decline from the $64,142 swing high to the $59,666 low.
Bitcoin price is trading below $62,800 and the 100 hourly Simple moving average. Immediate resistance is near the $62,000 level. It is close to the 50% Fib retracement level of the recent decline from the $64,142 swing high to the $59,666 low.
The first major resistance could be $63,000. The next resistance now sits at $64,200. If there is a clear move above the $64,200 resistance zone, the price could continue to move up. In the stated case, the price could rise toward $65,000.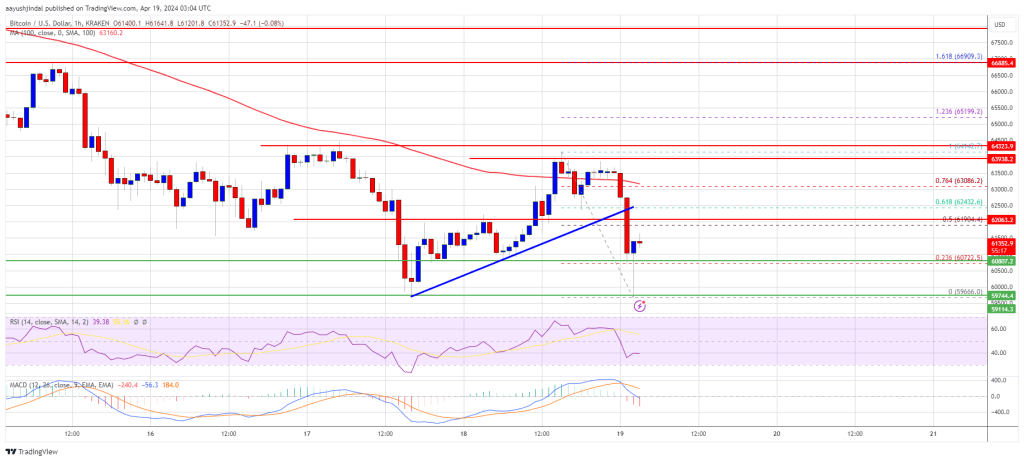 Source: BTCUSD on TradingView.com
The next major resistance is near the $66,500 zone. Any more gains might send Bitcoin toward the $67,500 resistance zone in the near term.
More Losses In BTC?
If Bitcoin fails to rise above the $62,000 resistance zone, it could start another decline. Immediate support on the downside is near the $60,800 level.
The first major support is $60,000. If there is a close below $60,000, the price could start to drop toward the $59,550 level. Any more losses might send the price toward the $58,500 support zone in the near term.
Technical indicators:
Hourly MACD – The MACD is now gaining pace in the bearish zone.
Hourly RSI (Relative Strength Index) – The RSI for BTC/USD is now below the 50 level.
Major Support Levels – $60,800, followed by $60,000.
Major Resistance Levels – $62,000, $63,000, and $64,200.


![Nekodex – Earn 20K+ NekoCoin ($20) [Highly Suggested]](https://cdn.bulbapp.io/frontend/images/b4f0a940-f27c-4168-8aaf-42f2974a82f0/1)


![[ℕ𝕖𝕧𝕖𝕣] 𝕊𝕖𝕝𝕝 𝕐𝕠𝕦𝕣 𝔹𝕚𝕥𝕔𝕠𝕚𝕟 - OM(G) , My Biggest Bag Was A Scam????](https://cdn.bulbapp.io/frontend/images/99de9393-38a8-4e51-a7ab-a2b2c28785bd/1)