The providers of Bitcoin ETFs have accumulated a massive amount of BTC, valued at 14 billion USD.

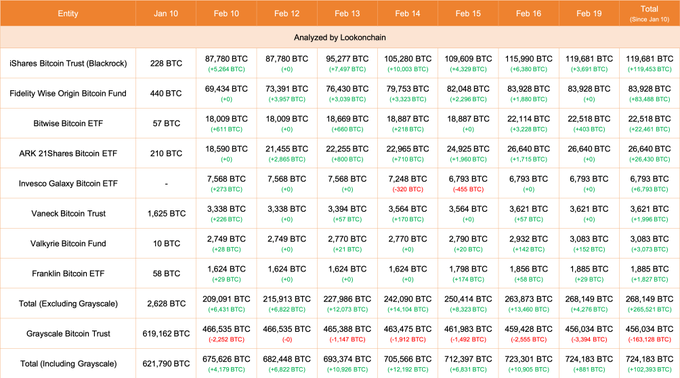
The advent of Bitcoin ETFs has marked a significant milestone for cryptocurrency, signaling the increasing acceptance by institutional investors. Since their establishment, 8 ETFs have accumulated an impressive total of 268,149 BTC, valued at approximately 13.97 billion USD.
Topping the accumulation list is BlackRock's iShares, with a remarkable holding of 119,681 BTC, valued at approximately 6.23 billion USD. This substantial holding underscores the confidence of major financial players in the potential of Bitcoin.
The holdings breakdown provides a clear picture of the performance of different Bitcoin ETFs. For instance, aside from iShares, notable accumulations can be seen in funds such as Fidelity Wise Origin Bitcoin Fund and ARK 21Shares Bitcoin ETF, reflecting these providers' bullish views on digital asset appreciation.
Leading the accumulation list is BlackRock's iShares, boasting an impressive holding of 119,681 BTC, valued at approximately 6.23 billion USD. This substantial holding underscores the confidence of major financial players in the potential of Bitcoin.
The holdings breakdown provides a clear picture of the performance of various Bitcoin ETFs. For instance, beyond iShares, notable accumulations can be observed in funds such as Fidelity Wise Origin Bitcoin Fund and ARK 21Shares Bitcoin ETF, reflecting these providers' bullish perspectives on the appreciation of digital assets.
These strategic accumulations by ETF providers have significantly surpassed the selling pressure that Grayscale has demonstrated in the past.
Shifting the focus to the analysis of Bitcoin's price, market sentiment remains optimistic.
The chart illustrates a continuous upward trend, with prices moving above key moving averages, acting as support levels. These moving averages are often considered indicators of investor sentiment, and their upward sequence indicates a strong upward trend.
Key support and resistance levels can also be gleaned from the chart. The current support levels are represented by the 50-day moving average, followed by the 100-day moving average and the 200-day moving average.
Dipping below these levels may signal a change in the trend, while consistent support above them will reinforce positive momentum.
On the upside, resistance levels may be encountered near recent highs, and if breached, could indicate further growth potential.
![[ℕ𝕖𝕧𝕖𝕣] 𝕊𝕖𝕝𝕝 𝕐𝕠𝕦𝕣 𝔹𝕚𝕥𝕔𝕠𝕚𝕟 - And Now What.... Pray To The God Of Hopium?](https://cdn.bulbapp.io/frontend/images/79e7827b-c644-4853-b048-a9601a8a8da7/1)


![[LIVE] Engage2Earn: McEwen boost for Rob Mitchell](https://cdn.bulbapp.io/frontend/images/c798d46f-d3b8-4a66-bf48-7e1ef50b4338/1)


